Have you ever heard, especially over the past few years, people saying "summer starts earlier these days"? Or "summer is getting longer"? Or even "we go straight from summer to winter"?
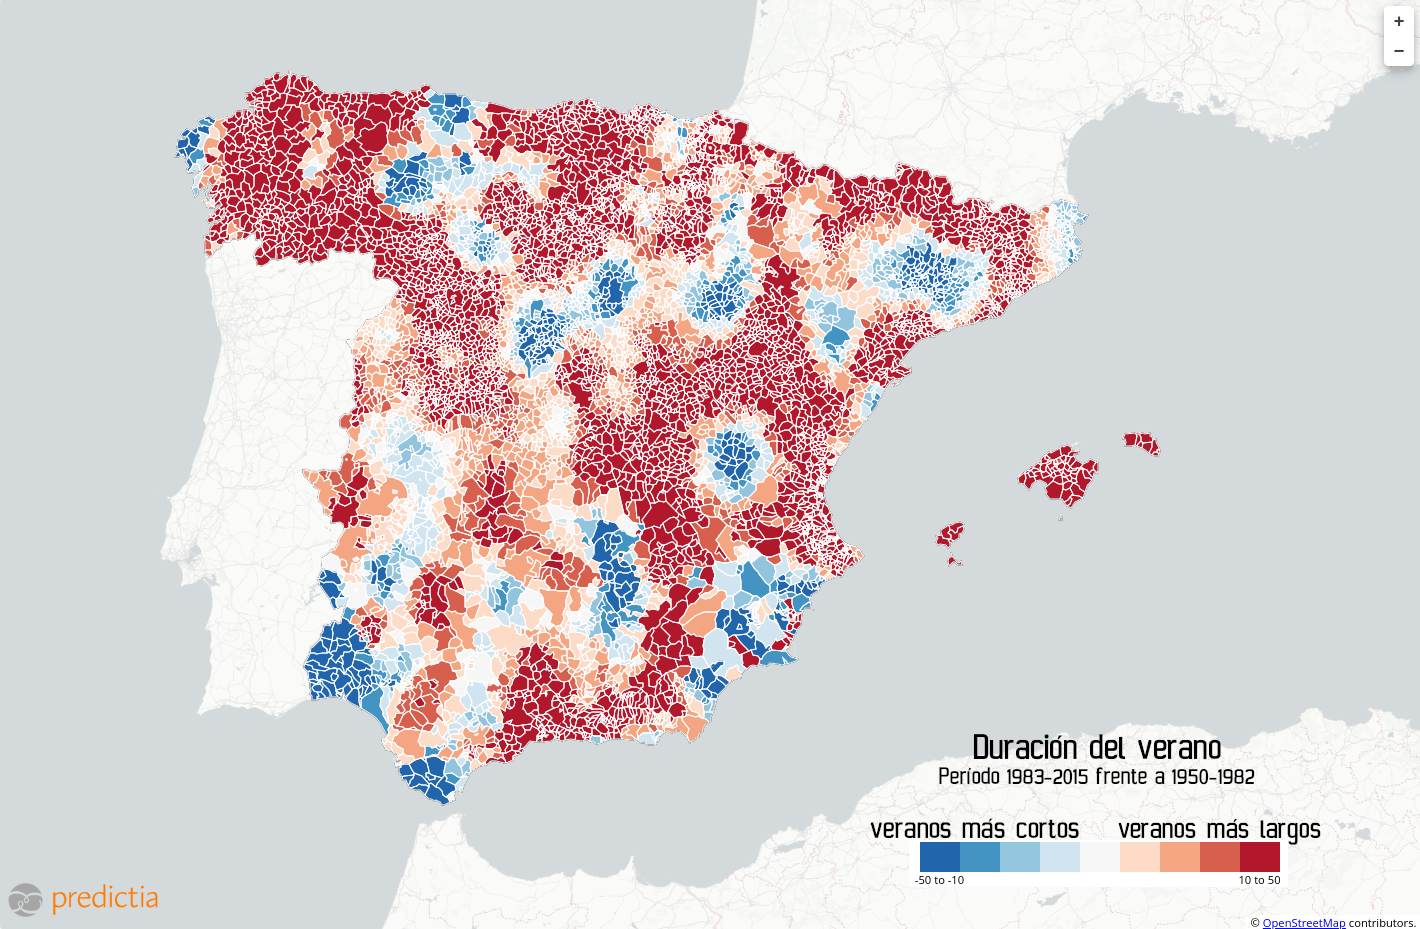
Here we present an interactive, town-per-town map showing an affirmative general trend - summer is getting longer in Spain indeed. And you'll also see it's getting shorter in some spots!

For this visualisation, we've used Spain's Meteorology State Agency (AEMET) and Santander Meteorology Group data and have sticked to AEMET's definition of summer (link in Spanish):
first 7 days in a row from 1st May on where the maximum temperature equals or tops the mean maximum temperature registered between 18-24 June in the period 1981-2010. Same goes for the end of summer - last 7 days in a row up to 31st October where the maximum temperature equals or tops the mean maximum temperature registered between 18-24 September in the period 1981-2010
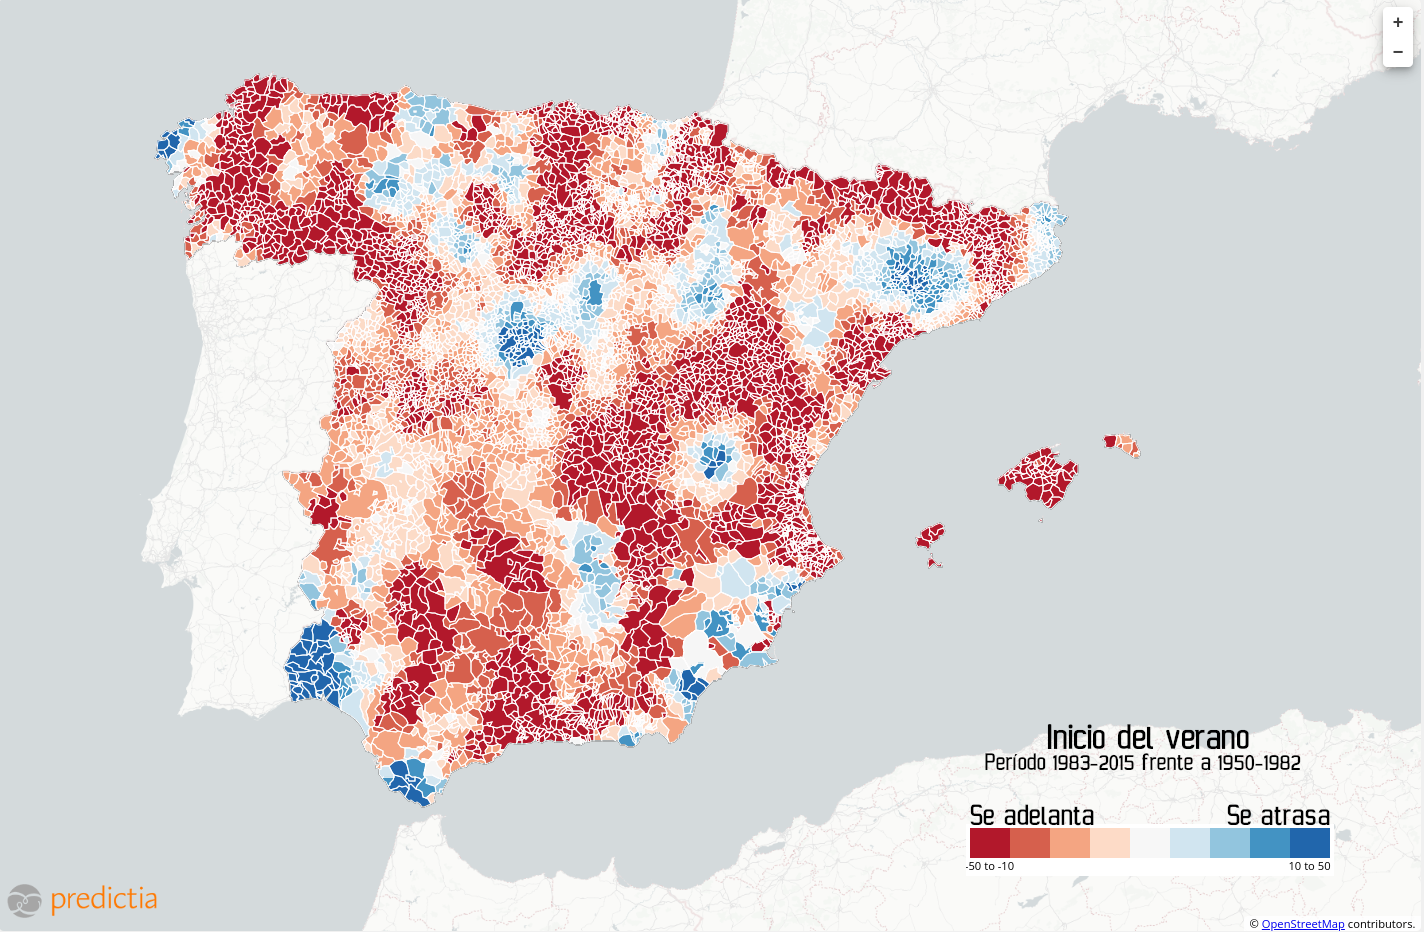
We've compared the 1950-1982 period (we've called this "first period") and the 1983-2015 ("second period") to check the historical evolution of summer in mainland Spain and the Balearic Islands. And so, taking the AEMET definition into account, we've created this map showing where summer is increasingly starting ealier...

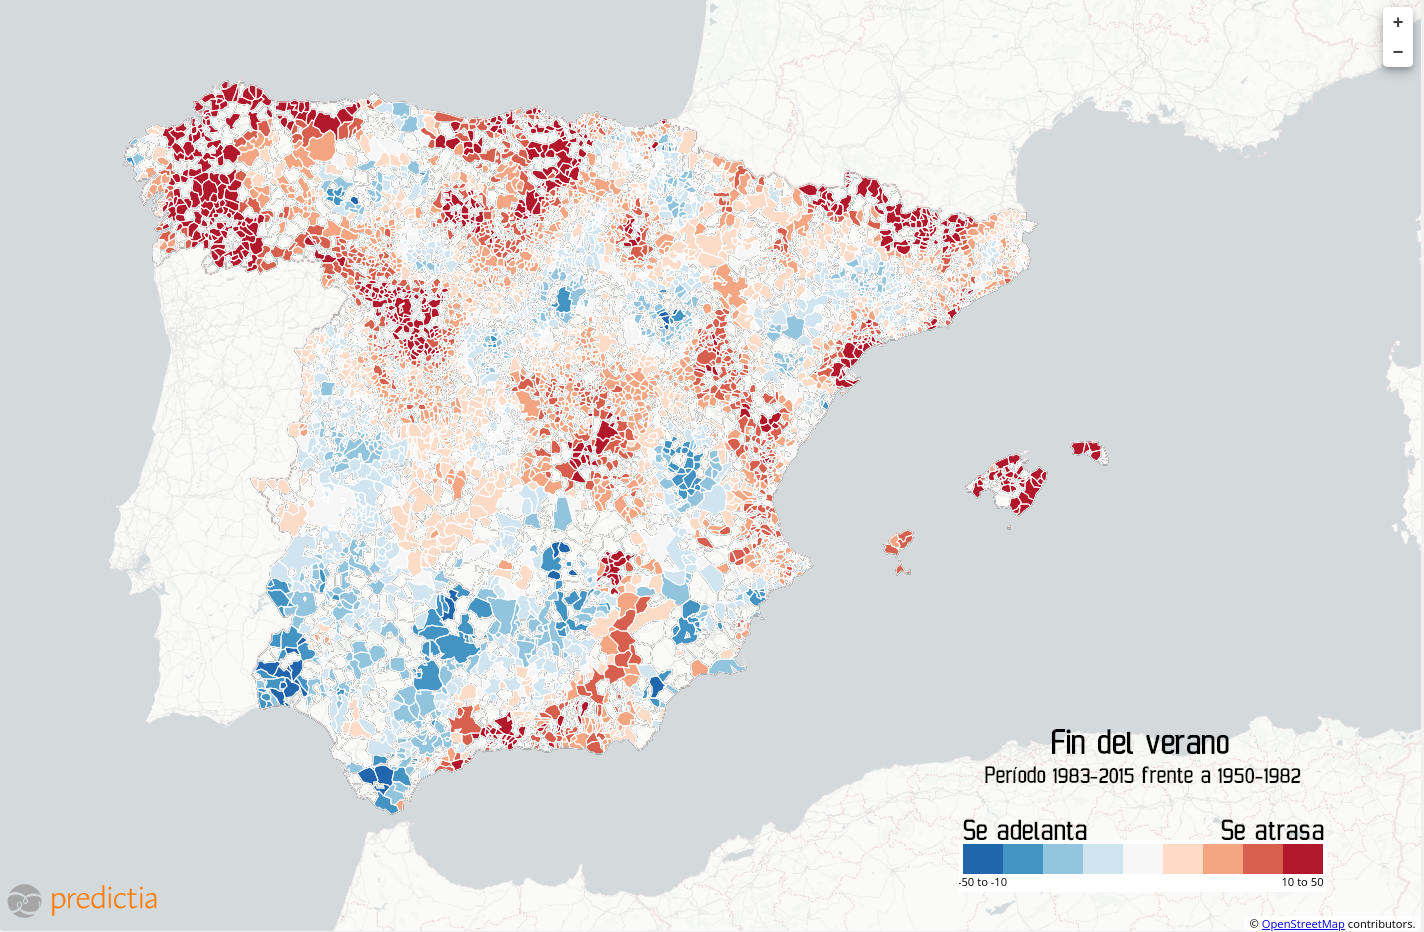
...and where summer is ending later.

We obtained the first map shown in this post as a result of this comparsion.
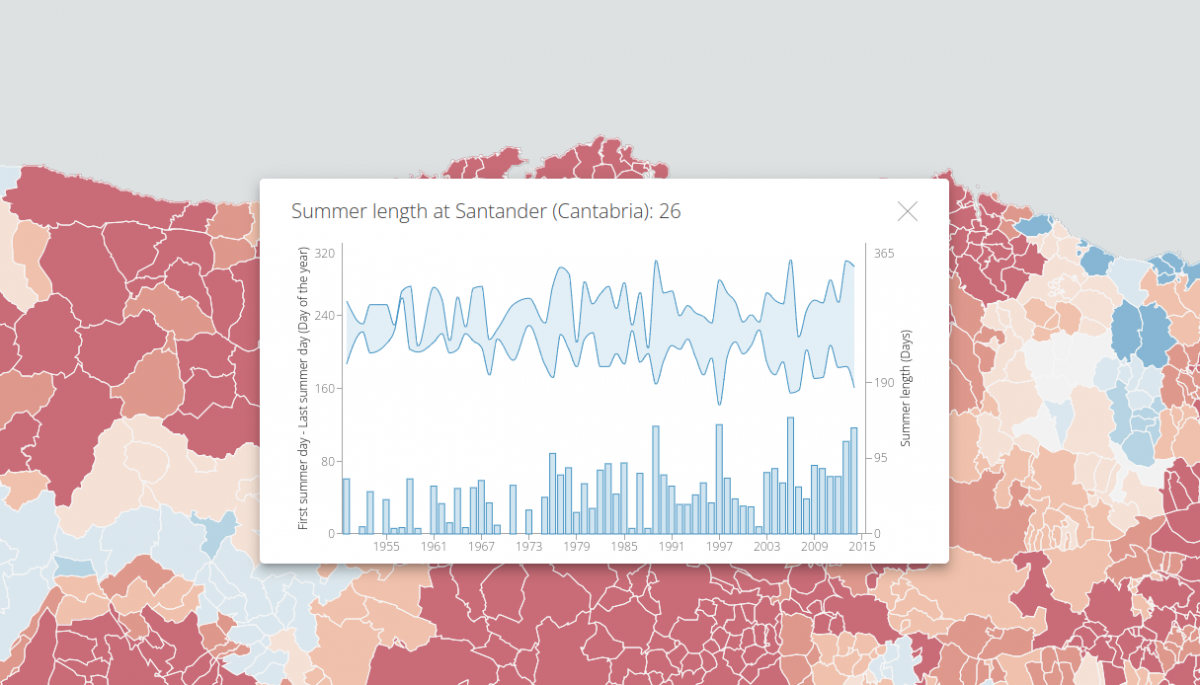
One can also see yearly in-detail data in this paradigmatic case of summer extension - the very city we're based in, Santander.

You may browse the data for your own town and play the different options available to extract data such as - when did summer start in my grandparents' village in the 60s?. Try it here.
And should you need any fancy data visualisation solution such a this, don't hesitate to reach out to our team.
