1990 had a rough start for many places across Europe. Between the 25th January and 1st March of 1990, eight severe storms crossed Europe, causing losses of almost 13€ billion. Two of these storms (Daria and Vivian), account for a big chunk of these losses, as they are in the ranking of the five highest loss events in Europe since 1970, according to the Swiss Re insurance company. Winter storms such as these constitute the costliest natural hazards for Europe, with each event inflicting billions of euros in losses per event. Of all hazards affecting Europe since 1970, the top 5 highest loss events were all winter windstorms.
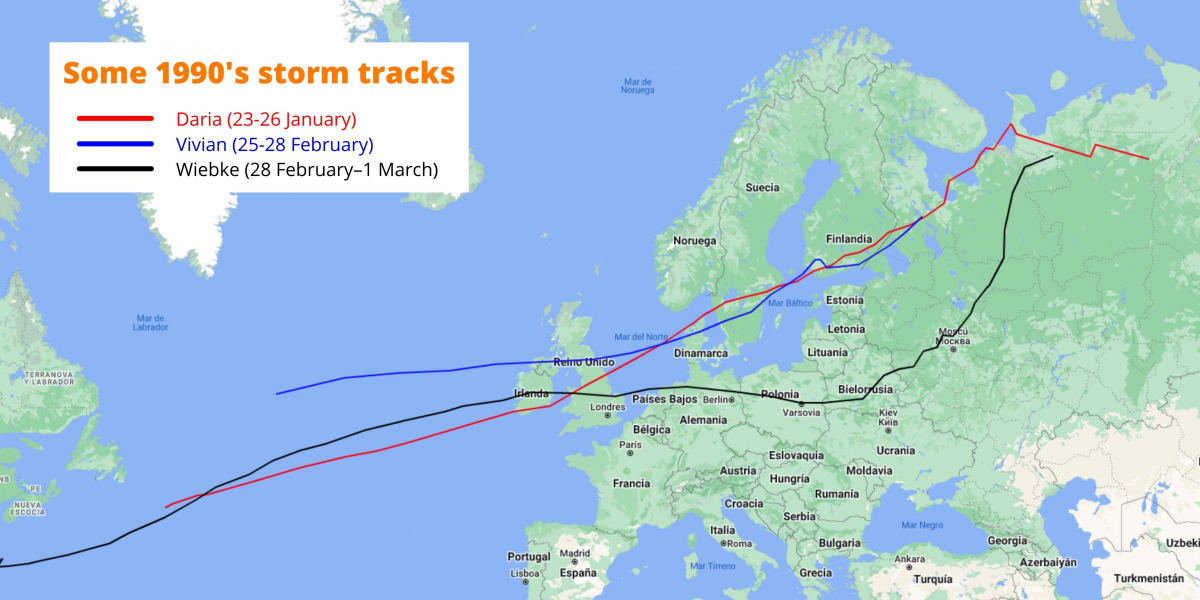
In this context, insurance companies are highly interested in such events, since they have such a high impact in our society. Today, we want to talk about modelling wind storms, the problems we face when doing so, and the value they add. And for that, we’re going to dive into one of the results of the project PRIMAVERA that we took part in. For those of you savvy with technical details, you can go directly to the pre-print in NHESS.
Let’s start with some context around winter storms and insurance companies. At any given moment, the insurance companies in Europe are required by law to have enough capital to cover any events that happen every 200 years. However, we do not have systematic climate records that span that long. The best we have are reanalysis datasets such as ERA5 span “only” back to 1950. Reanalysis are datasets that fill in the gaps of meteorological records, by using climate models that simulate the weather. Although they are sometimes the best estimate on many variables (winds, temperatures, precipitation…), they have some limitations, like the time span that we mentioned before, or the fact that computing them requires heavy computational power. So, what can climate modellers do?
This is where the PRIMAVERA project comes in: it developed a new generation of climate models, that are well-evaluated and offer high-resolution, with a global coverage. The aim is that these models are useful for governments, society in general and different economic sectors. One of these sectors is, of course, insurance. In this paper, the team used five different climate models, covering the period from 1950 to 2014. Overall, this is equivalent to ~1300 years of modelled data. This massive amount of data was necessary to study events that only happen every 200 years. The data was also post-processed, so the final dataset has a high-resolution (0.25º by 0.25º, which is roughly 27 Km, although it varies with the latitude). If you’re interested in the technicalities of post-processing, head down to the Methodology section.
However, having the raw data from the models is not enough, it must be analysed from the perspective of insurers, to identify the windstorms in the dataset. Which raises interesting questions:
- How do you detect a storm in the data from PRIMAVERA?
- How do you define a winter windstorm?
- And how do you quantify the impact they have?
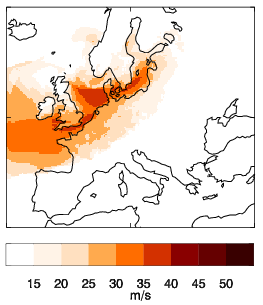
For the first question (how to detect a storm in the dataset), the researchers used the algorithm TRACK. It was published by Kevin Hodges in 1995, and updated in 1999. Once you locate a wind storm in the data, you have to see how it evolves over time, what areas it affects and how. Meteorologists call this a “footprint”: a diagram showing how the winds have evolved in the storm. Luckily, the insurance companies have a very straightforward definition for the footprint as well: “the maximum wind gust associated with the storm over a 72 hour period”. Let’s dissect what this means. First of all, wind gusts are brief increases in the speed of the wind that usually last less than 20 seconds. So, to create a diagram like the one above, which is the footprint of storm Daria, meteorologists go over the data of 3 days during the storm, see the maximum gusts of that period and draw them on the map. And for the gusts, they rely on the World Meteorological Organisation, which defines gusts as “the maximum 3-s average wind speed at 10m height”.
So, it would seem that we got wind gusts covered. But not really. The problem is that most climate models do not give the data of wind gusts directly as an output. Therefore, the team extracted the daily maximum surface winds, and converted them into gusts using statistical approaches. If you’re interested in the details, head down to the Methodology section!
With this, the PRIMAVERA team knew how to track Winter wind storms in the data, and generate their footprints. But all of this frames things from the climate side of things. What about the economic side of things? How do you go from climate to societal impact?
To estimate the potential damage of the windstorms identified in the data, the researchers relied on the Loss Index (we know, very original naming), that takes into account the area affected by the storm, the population density and the extreme wind gusts in the area.
So, the researchers applied this Index to the data of the five climate models from PRIMAVERA, and found well over 250 000 footprints of storms that happened in the simulations. Of them, nearly 70 000 had a non-zero Loss Index (meaning they are wind storms that have some kind of impact), and ~2700 of those storms are severe: of the type of storms that occur approximately once every two winters over Europe and make up 70% of total losses. The results match well with the data for the past climate: the low resolution simulations underestimate a bit the number of storms per winter, but this is improved by the higher resolution models. This also confirms one of the main points of PRIMAVERA: having higher resolution models allow for a better representation of the climate.
And what’s next? Well, in this paper the researchers have developed a robust method for tracking and reproducing winter windstorms, and quantifying their potential impact. So, there’s work to be done in refining the method further… and expanding it into the future, with the PRIMAVERA climate change projections that cover up until 2050. Interested in knowing more? Get in touch directly with the PRIMAVERA team!
Interested in the windstorm data from PRIMAVERA? The event set is available now in Zenodo!
Methodology
In this section you will find all the nitty-gritty details about the paper.
The PRIMAVERA models used for the event set are summarised in the table below. Each model was run at both a standard CMIP6-type resolution (typically 100 km) and at a significantly higher resolution (towards 25 km). Some models ran multiple ensemble members.
| Institution | MOHC, UREAD, NERC | EC-Earth KNMI, SHMI, BSC, CNR | CERFACS | MPI-M | CMCC |
| Model name | HadGEM3- GC3.1 | EC-Earth3P | CNRM-CM6.1 | MPI-ESM1.2 | CMCC-CM2- (V)HR4 |
| Resolution names | LM, MM, HM | LR, HR | LR, HR | HR, XR | HR4, VHR4 |
| Atmospheric nominal resolution (CMIP6) | 250; 100; 50 | 100; 50 | 250; 50 | 100; 50 | 100; 25 |
| Ensemble members at each resolution | 5;3;3 | 2;2 | 1;1 | 1;1 | 1;1 |
Insurance industry standards prefer very high resolution grids, with maximum grid spacing ~25 km, although less than 10 km is preferred. To be consistent with these industry standards, the footprints must be downscaled to a common grid. The target grid was the same as ERA5 gusts: 0.25°x0.25°, which is approximately 18 km grid spacing at 50° N. This reference is not casual: it facilitated the validation process explained at the bottom of the section. To achieve both the conversion from winds to gusts and bias-correction, the PRIMAVERA team used quantile mapping. The method is as follows:
- The model daily maximum wind speeds are downscaled to the ERA5 grid using linear interpolation.
- At probability intervals of 0.5% up to the 98th percentile, the team calculated the empirical cumulative distribution function (CDF) at each individual grid point.
- Above the 98th percentile, the CDF is fitted using a generalised Pareto distribution (GPD), which is commonly used for fitting extreme wind speeds.
- The GPD fitting is performed separately for each model.
To validate the PRIMAVERA event set, footprints were also made from the ECMWF Reanalysis 5th Generation (ERA5; Copernicus Climate Change Service, 2017) wind gusts. This data set covers the period 1979–2014, on a 0.25°0.25° grid (~18km grid spacing at 50° N). Hourly maximum gusts for October–March were extracted and converted to daily maxima for fair comparison with PRIMAVERA models.