VALUE Validation Portal
VALUE Validation Portal
VALUE COST Action (2012-2015) aims to establish an european network to validate and improve downscaling methods for climate change research, while improving the dialogue between downscaling researchers and stakeholders. The Action will sytematically compare the different downscaling approaches and assess aspects such as temporal variability from sub-daily to decadal time scales including climate change, extreme events, spatial coherence and variability, and inter-variable consistency together with the related uncertainties.
Predictia has developed web portal for validation that allows project's participants to send their projections in the predefined data format. The portal evaluates automatically this projections, using a R package that computes tens of validation indices related to the accuracy or reliability of the climatic projections.
This project generated a special issue on the International Journal of Climatology.
Key features
Main features
The portal allows project's participants to send their regional climatic projections for validation. The portal uses a R package that computes several validation indices suitable for this kind of projections. This package has been developed by the Santander Meteorology Group with the assistance of Predictia. This package contains a repository of validation functions provided by the different institutions that participate on the project.
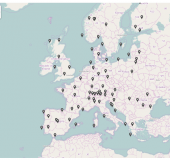
Portal administrators can define experiments, involving different validation periods, meteorological variables and station sets. The validation indices that will be computed depend on the experiment and the type of projection (whether it is deterministic or stochastic).
The portal also lets users provide structured detailed descriptions about the characteristics of the downscaling method that was used to create the projections.
Validation indices
The portal computes a lot of standard validation indices such as: mean, variance, skewness, Cramer van Mises, ACF lag 1,2,3, 98th percentile, 20 year return level (left/right tail), 20 season return level (left/right tail), number of days above XX°C, number of days below XX°, median of spell length distribution , 90th percentile of sld, median of ann. max. numb. consec. spell days, minimum of annual cycle, maximum of annual cycle, relative amplitude of annual cycle, proportion of variance in low frequency, sign of low pass filtered signal
Indices's computing
Fore some combination of experiments and projections, calculating the indices can become really expensive in terms of computation resources. This is the case of stochastic methods (it has been established a standard of 100 realizations in this methods), where the user's projections can weight in the order of hundreds of MBs and computing the indices can involve plenty of minutes of CPU usage.
For the validation process, the portal makes use of a queue system that sends the jobs to several instances of R, exposed as a service with Rserve.
Result analysis
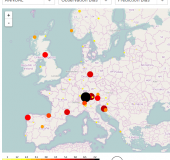
The portal allows the visual exploration of the results, using tables and maps. This visualization widgets allow simultaneous analysis of several variables and seasons of the year.
Results can be easily exported for further analysis with external tools like R.
Publications
- Maraun, D, Widmann, M, Gutiérrez, JM. Statistical downscaling skill under present climate conditions: A synthesis of the VALUE perfect predictor experiment. Int J Climatol. 2019; 39: 3692– 3703. https://doi.org/10.1002/joc.5877
- Gutiérrez, JM, Maraun, D, Widmann, M, et al. An intercomparison of a large ensemble of statistical downscaling methods over Europe: Results from the VALUE perfect predictor cross‐validation experiment. Int. J. Climatol. 2019; 39: 3750– 3785. https://doi.org/10.1002/joc.5462
- Maraun, D, Huth, R, Gutiérrez, JM, et al. The VALUE perfect predictor experiment: Evaluation of temporal variability. Int J Climatol. 2019; 39: 3786– 3818. https://doi.org/10.1002/joc.5222
- Widmann, M, Bedia, J, Gutiérrez, JM, et al. Validation of spatial variability in downscaling results from the VALUE perfect predictor experiment. Int J Climatol. 2019; 39: 3819– 3845. https://doi.org/10.1002/joc.6024


