
An Evolution of the IPCC Atlas
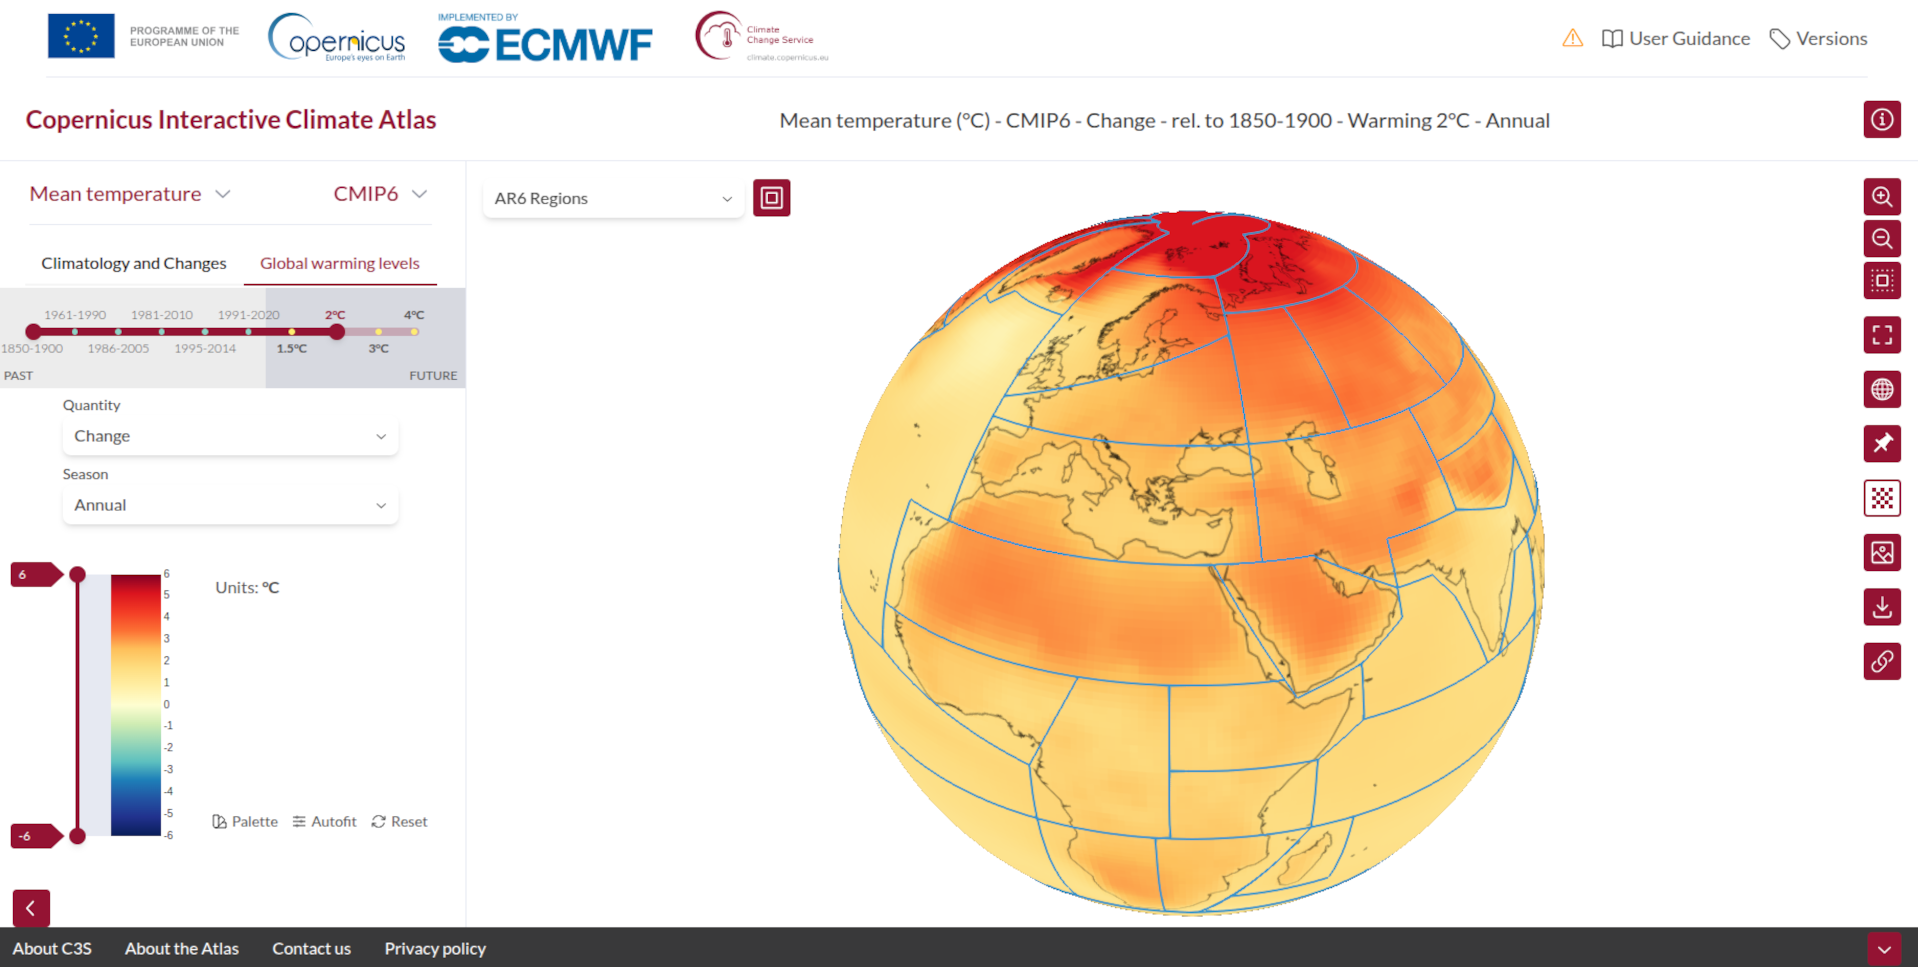
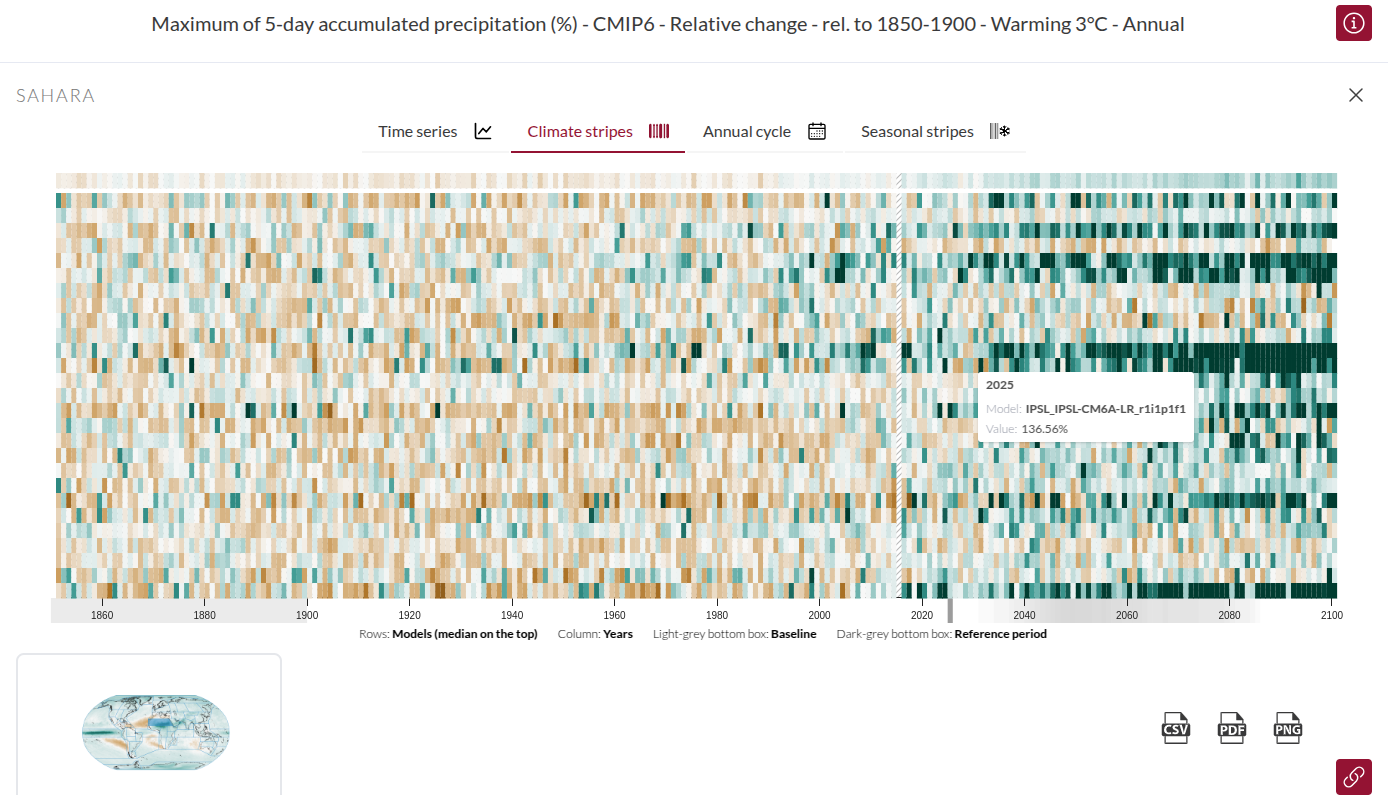
The Copernicus Climate Change Service (C3S) Atlas has additional datasets and more variables than the AR6 WGI IPCC Interactive Atlas (IPCC-IA), and it will have further enhancements in the future. One key additional feature is the possibility to select a country or multiple countries as predefined regions or to compute regional products on-the-fly for any customised regions. This makes it possible, for instance, to select any transboundary regions, where the information provided by the C3S Atlas can support coordinated actions of multiple countries. In any of the predefined and user defined regions, the user can visualise regional information products, such as time series, climate stripe plots or annual cycles.
The C3S Atlas provides different options to download the different products and the underlying data, including the monthly gridded dataset of the full set of variables across the different datasets underpinning the C3S Atlas.
Key variables for risk assessment
The C3S Atlas expands beyond the list of 21 variables / indices included in the IPCC-IA in order to better characterise key hazards. It thus supports and expands the global and regional climate change assessment made in the Assessment Report 6 (AR6) Working Group I report.
Besides near-surface air and sea temperatures, precipitation and wind, the C3S Atlas includes additional essential climate variables, such as near-surface humidity, surface radiation fluxes, soil moisture and runoff, as well as various indices characterising different types of climatic impact-drivers. The selection of such new variables is based on the IPCC experience and particularly on user feedbacks on the IPCC-IA. For ease of navigation and to improve the user experience, all indices have been grouped around common themes: heat and cold, wet and dry, wind and radiation, snow and ice, ocean, and circulation. The first version of the C3S Atlas included a total of 30 variables and indices.
Periodic updates are planned to incorporate new variables and indices aligned with C3S needs and with key international initiatives, such as the IPCC.
This set of 30 indices has been systematically computed (where data are available) for a number of authoritative and quality-assured C3S datasets. They provide information about the past and present climate (observations and reanalyses) and our possible climate futures (global and regional climate projections), with key complementary lines of evidence for climate change risk assessment. The C3S Atlas includes observation-based products, such as the E-OBS gridded observational database, which tracks temperature in Europe since 1950, as well as reanalyses like ERA5 and ERA5-Land. These reanalyses represent the state of our climate since 1940 (1950 for ERA5-Land). The application shows the data until 2022 and will be updated regularly, for instance every March, when all the data for the previous year are consolidated. Meanwhile, the near-real time ERA5 dataset ERA5T – up to five days before the current day – is available in the Climate Data Store.
Periodic updates are planned to incorporate new variables and indices aligned with C3S needs and with key international initiatives, such as the IPCC
The C3S Atlas also includes ocean data (ORAS5 ocean reanalysis) from 1958 to 2014 to analyse the climatic conditions of different oceanic variables (sea-surface temperature and sea-ice extent).
The Atlas includes state-of-the-art climate model projections to explore a variety of possible climate futures. They describe the evolution of the climate system based on simulations produced with Global and Regional Climate Models (GCMs and RCMs). They are forced with historical conditions and different future emission scenarios over the period from 1850 to 2100. The Coupled Model Intercomparison Project Phase 6 (CMIP6) is the reference framework for global climate projections and was essential to the work of the IPCC AR6. The application also provides access to the fifth phase of CMIP, CMIP5, which was the basis for the IPCC Fifth Assessment Report (AR5) and the special report for 1.5º global warming. This is still widely used as an alternative line of evidence.
Besides the global projections, the C3S Atlas also gives access to the regional projections created by the Coordinated Regional Climate Downscaling Experiment (CORDEX) driven by CMIP5 global forcings; in particular, CORDEX-EUR-11 high-resolution projections and CORDEX-CORE, complementing the CORDEX domain-by-domain information included in the IPCC Interactive Atlas.
These two datasets provide the projections with the highest resolution available for the European domain (12.5 km) and for a global mosaic covering all land inhabited regions (25 km), respectively.
Downloading the visual products and the underlying data
A variety of options exist to download the visual outputs and the underlying data in user-friendly formats.
Maps can be downloaded as PNG files and the underlying data as NetCDF, commonly used by climate practitioners, or GeoTIFF, commonly used by the Geographical Information Systems (GIS) community. All regional information products can be exported in PDF and PNG formats, and the underlying data (numbers) as a CSV file. All these products are distributed with an open licence, facilitating reusability.
FAIR principles for reproducibility and reusability
The development of the IPCC Interactive Atlas embodied a pioneering effort to integrate FAIR data principles (for Findability, Accessibility, Interoperability and Reusability) into climate policy reports (such as IPCC reports), thereby significantly enhancing their transparency and reproducibility. These principles have been adopted and expanded in the C3S Atlas by publishing the underpinning dataset in the C3S catalogue, thus facilitating findability, accessibility, and reusability, and thoroughly documenting the data sources and processes used to produce the climatic products shown by the C3S Atlas.
These activities will be complemented in the future by providing reusable code in Jupyter notebooks. These notebooks will illustrate the workflow followed to produce the C3S Atlas dataset and graphical products. Additionally, machine-readable standard provenance information will be provided for reproducibility. This information comprises a comprehensive description of the main climate data sources (primarily CMIP5/6 and CORDEX subsets), post-processing methods (such as temporal aggregation and regridding), calibration techniques (including bias adjustment), and graphical outputs (such as geographical extent, colour bars, and displayed entities and layers)
Detailed regional information with a variety of visual products
Beyond spatial map information, the C3S Atlas makes it possible to explore regionally aggregated information for a number of predefined regions, shown in the ‘region set’ selector. Single or multiple regions can be selected by clicking directly on the map. Predefined regions include:
- The IPCC AR6 reference regions, which were used in the AR6 WGI report for regional climate change assessment.
- The EUCRA regions, which are used in the European Climate Risk Assessment.
- European countries, including those countries covered by the regional European datasets: EOBS and CORDEX-EUR11.
The regionally averaged information shown by the C3S Atlas for these predefined regions is pre-computed and can be explored interactively by clicking the ‘regional information’ button, which becomes visible when a region is selected.
The user can also select customised regions, which can be defined using the ‘user defined’ option in the region selector. A custom new region can be drawn directly on the map after clicking the ‘pencil’ button. This action creates an offline job which enters a queue system, passing through different states until completion, typically in a few seconds. Complementary aspects of regional information are shown using different graphical products. All these graphical elements are dynamically updated when changing the choices in the selection panel.