
Context and main goals
This viewer has been developed on the framework of the PNACC
and the project LIFE SHARA Sensibilización y Conocimiento para la Adaptación al Cambio Climático. The goal of LIFE SHARA is to improve the governance of the adaptation to climate change, as well as increasing the resilience of Spain and Portugal. This project is coordinated by the Ministerio de Agricultura
y Pesca, Alimentación y Medio Ambiente through the Fundación Biodiversidad, with the technical direction of the Oficina Española de Cambio Climático. Other partners are AEMET, the Organismo Autónomo de Parques Nacionales, through the Centro Nacional de Educación Ambiental (CENEAM) and the Agencia Portuguesa de Medio Ambiente.
The goal of the viewer is to easily provide access to the last generation of regional climate change projections over Spain. In order to achieve this, the user is kept unaware of the specific data formats used by the models (for example, netCDF). Also, some of the transformation operations most demanded by the final users are offered: spatial filtering, temporal aggregation, computation of specific indexes or anomaly computation.
Available data
Data of the latest regional climate change projections over Spain have been added to the viewer. Additionally, two sources of observational data have been added as a reference:
- Gridded data (~10 km resolution) of regional climate change projections (dynamical downscaling), produced in the framework of the international project of Euro-CORDEX. It consists of a simulation set of 16 combinations from different models. It provides adjusted values to a 5km resolution grid using bias-adjustment techniques. These are obtained by applying statistical regionalisation tecniques for CMIP6 on 5km observed data grids on the Iberian Peninsula and Balearic Islands, and 2,5km on the Canary Islands.
- Detailed data (stations) of climate change projections (statistical downscaling) produced by AEMET.
- Observed detailed data (stations) from AEMET.
- Observed gridded data (~5 km resolution) from ROCIO_IBEB (observed gridded data produced by AEMET interpolated using optimal interpolation at 5km) used for bias adjustment in the EURO-CORDEX models and for statistical gridded regionalisation on the Iberian Peninsula and the Balearic Islands, and its counterpart on the Canary Islands, at 2.5 km resolution, used only for statistical regionalisation.
Data from future scenarios SSP1-2.5, SSP2-4.5, SSP3-7.0 and SSP5-8.5 for low, medium, high and very high emissions for the 21st century are available. For these scenarios, the periods for future analysis are available: short term (2011-2040), medium term (2041-2070) y long term (2071-2100). Besides, the so-called historical scenario provides model simulations in the climatic reference period 1971-2000.
Available variables
A set of standard climate variables is available, like temperature, precipitation, humidity and wind speed. Additionally, the user can access a set of climate indices derived from these variables, which are of special interest for many impact sectors. It follows a complete list of the variables and indices currently available in the viewer:
- Average temperature
- Minimum temperature
- Maximum temperature
- No. of days with the minimum temperature < 0ºC
- No. of days with the minimum temperature > 20ºC
- No. of warm nights
- No. of warm days
- Maximum duration of heat waves
- Cooling Degree Days
- Heating Degree Days
- Thermal range (in ºC)
- 99th percentile of daily thermal range (in ºC)
- Extreme maximum temperature
- Extreme minimum temperature
- 1st percentile of daily minimum temperature
- 5th percentile of daily minimum temperature
- 95th percentile of daily minimum temperature
- 5th percentile of daily maximum temperature
- 95th percentile of daily maximum temperature
- 99th percentile of daily maximum temperature
- Precipitation
- No. of days with precipitation < 1mm
- 95th percentile of daily precipitation
- Maximum precipitation in 24h
- Maximum number of consecutive days with precipitation <1 mm
- No. of rainy days
- Maximum number of consecutive humid days
- Maximum cumulative precipitation in 5 days
- Potential evapotranspiration
It is possible to visualise all these variables either with a yearly frequency or filtered for one season. It is also possible to visualise the anomaly (the difference with respect to the mean of a reference period) and the relative anomaly.
Visualisation elements
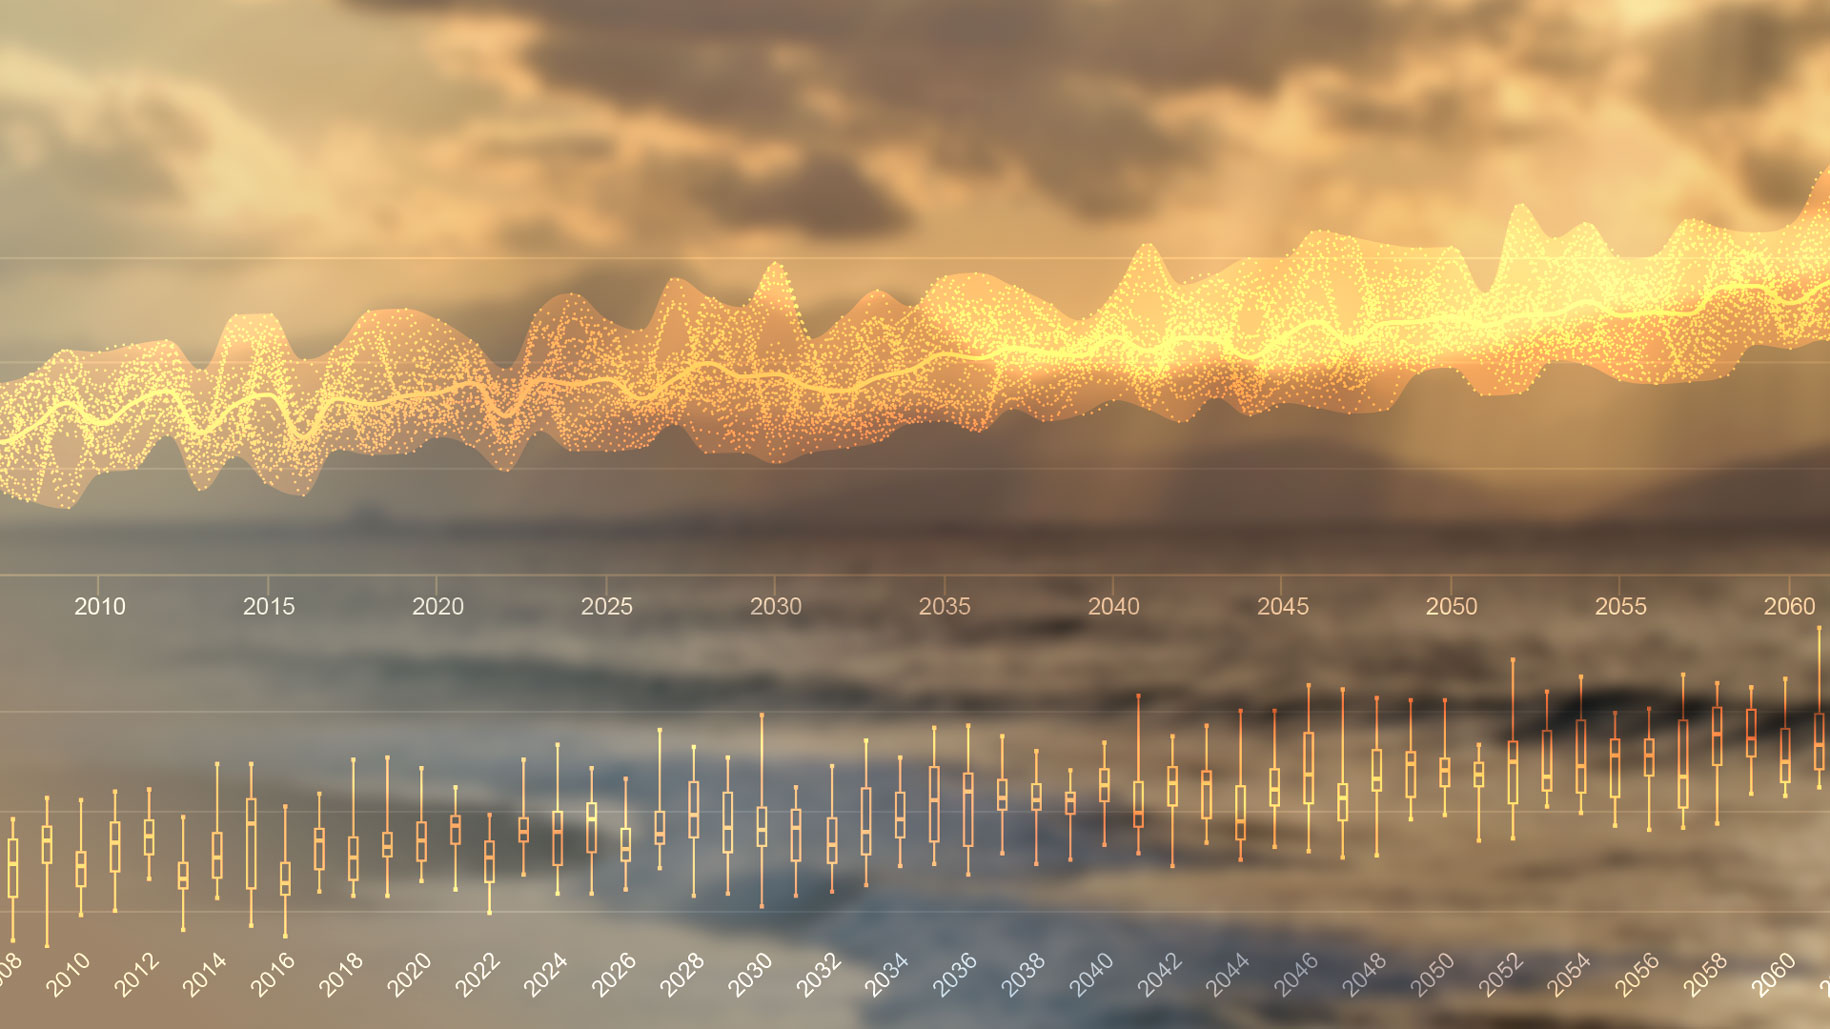
Thanks to Geographical Information Systems technologies, it is possible to visualise the information over an interactive map which feeds from a WMS server with support from climate data. Additionally, it is possible to represent the temporal evolution of the variables as a plume which, by including data of an ensemble of projections, allows to visualise the uncertainty in the future evolution of the variable. The uncertainty, defined as the dispersion of the data of the projection ensemble considered, can also be visualised by using boxplots.
Spatial filtering of the information
One of the most important functionalities is the ability to select and visualise the data of a specific region. In the viewer, the user can select a region from some predefined sets, or define a custom one by plotting a polygon over the map. The region sets currently available are the following:
- Autonomous Communities
- Provinces
- Municipalities
- Islands
- Hydrographic basins
- Hydrographic sub-basins
- National Parks
- Places of proposed community relevance (LIC)
- Areas of special protection for birds (ZEPA)
- Agricultural regions
- Wards in the Principality of Andorra
- AEMET precipitation stations
- AEMET temperature stations
- User-defined regions
Technologies used
The viewer uses several modules to provide the previously described functionalities:
- A WMS served based on the ADAGUC system.
- A component which downloads and processes climate projections implemented with python using packages like xarray. This component is responsible for processing steps like converting units, temporal aggregation, climate indices computation and concatenation of simulations for the generation of ‘multi-model’ fast-access netCDF files.
- A ‘back-end’ component based on Java and components of Spring project that provides different web services for accessing the information including functionalities like, for example, spatial filtering, report generation and handling background processes for large downloads.
- A PostgreSQL database with support for spatial data by using the PostGIS module.
- A ‘front-end’ web component, which allows to visualise the information with the different components previously described. It uses several javaScript libraries like Leaflet, jQuery and HighCharts.