Will those clouds hold the rain for twenty more minutes so that I can get home dry? If you ever wondered this, or got rained on unexpectedly on your way to work, to the movies or taking a stroll then chances are you’d be interested in Próxima Hora, the newly added nowcasting tool in our app.
What is it for? “It’s useful for knowing whether it would rain over the next ten, twenty, thirty minutes”, says Toño Cuadrado, in charge of developing our nowcasting tool. “Just by checking the app you’ll know if you are to wait ten more minutes until the rain stops or if you need to take your umbrella with you when you leave your place... It’s an everyday useful tool”, he adds.
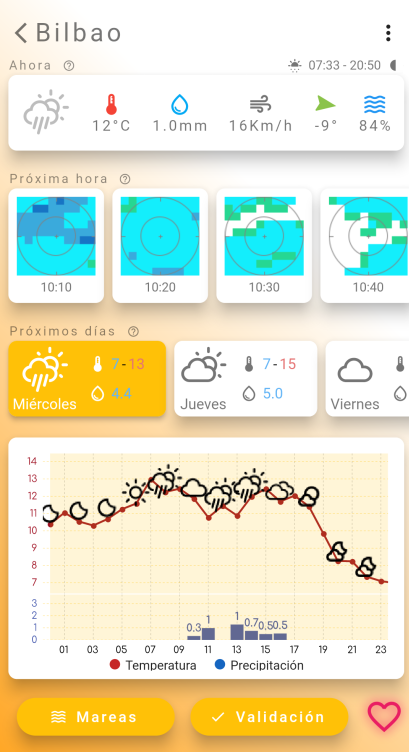
As we already published at the time of introducing our latest version of the Predictia Weather app, Próxima Hora shows the following sixty minutes of rain forecast at ten-minute intervals. This is how it looks in our app (that you may download for free here).
But what exactly happens from the moment rain, hail or snow are detected by AEMET’s radars until any Predictia Weather app user see it displayed in their cell-phones? What process does that information follow? How do you make such short-term forecasts?
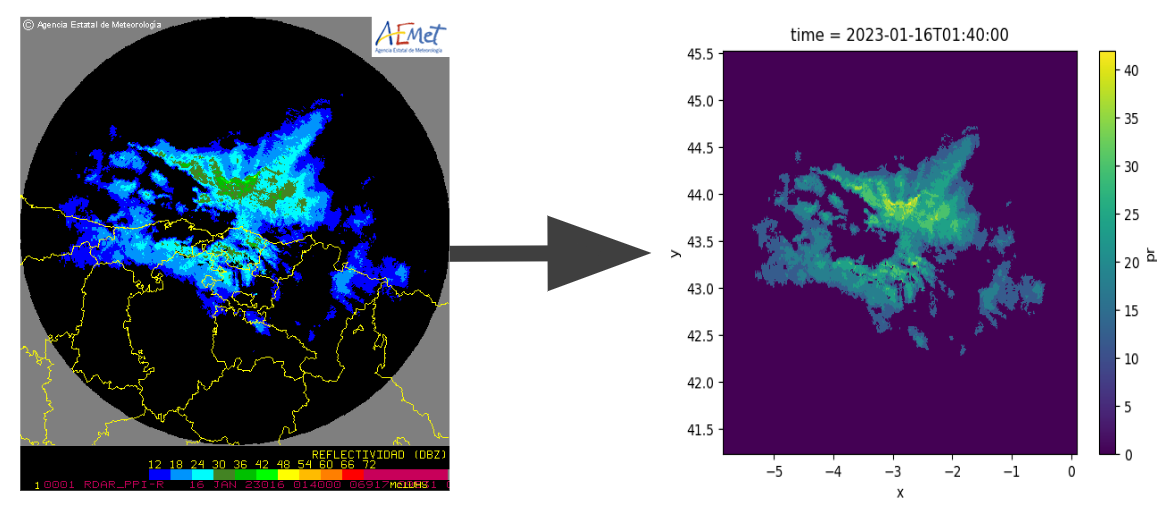
The first phase consists on automatically downloading AEMET radars’ images every ten minutes, Cuadrado (who holds a degree in Physics and a Masters in Data Science) explains. There are 14 AEMET radars in mainland Spain and the Balearic Islands.
As soon as they’re downloaded from AEMET’s Open Data, these images are processed to be stored in the netCDF format. This processing phase consists of various steps: georeferencing the pixels in the image and assign each of them a longitude and a latitude, extraction of radar ellipse, deletion of outliers, color calibration for pixels in decibels relative to reflectivity (dBZ) and the deletion of geographical administration lines and its filling with the KNN method. Lastly, the system deletes speckle noise shown in some of the radars.
After that, during the radar image postproduction phase, decibels relative to reflectivity (dBZ) are transformed into decibels of rain rate (dBR), where Z is reflectivity whilst R is rainfall intensity in mm/h. The Marshall-Palmer relation is used for this conversion.
Once AEMET radar images are converted into netCDF and in dBR, the forcast process starts, using the pySTEPS library. “You feed x images to the library”, Cuadrado explains. “Then you specify how many you aim at producing out of those. And it considers all images are equally spaced in time. In our case, six images in ten-minute intervals”.
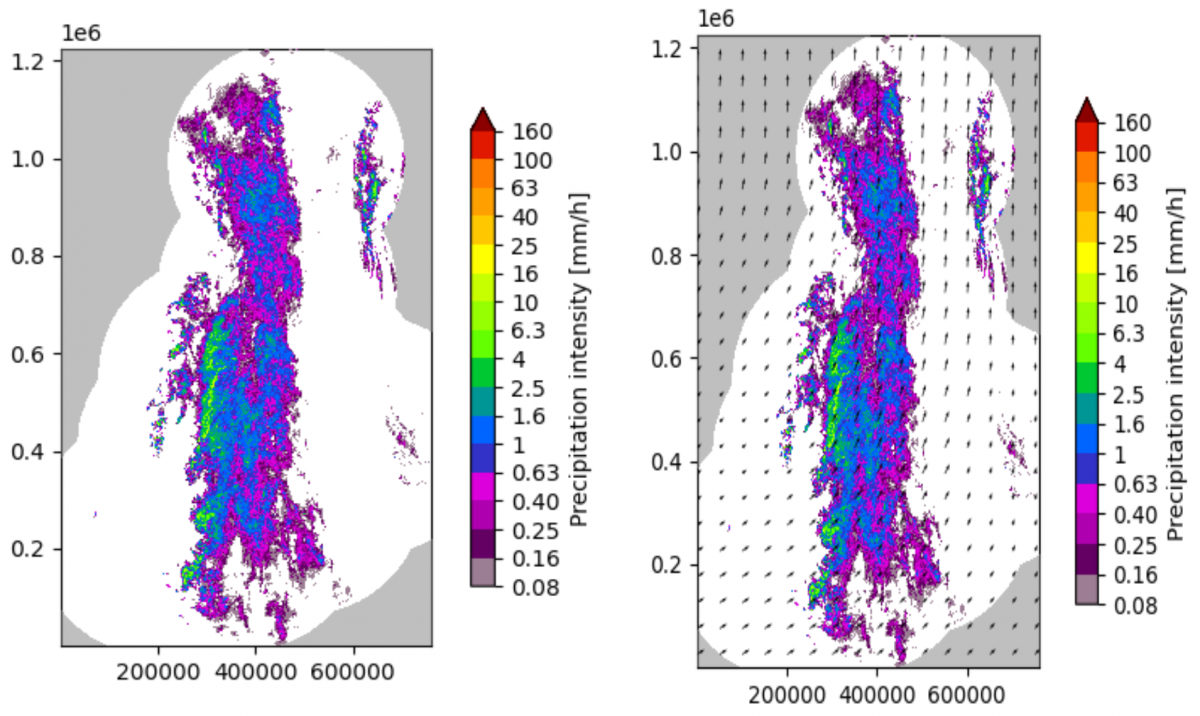
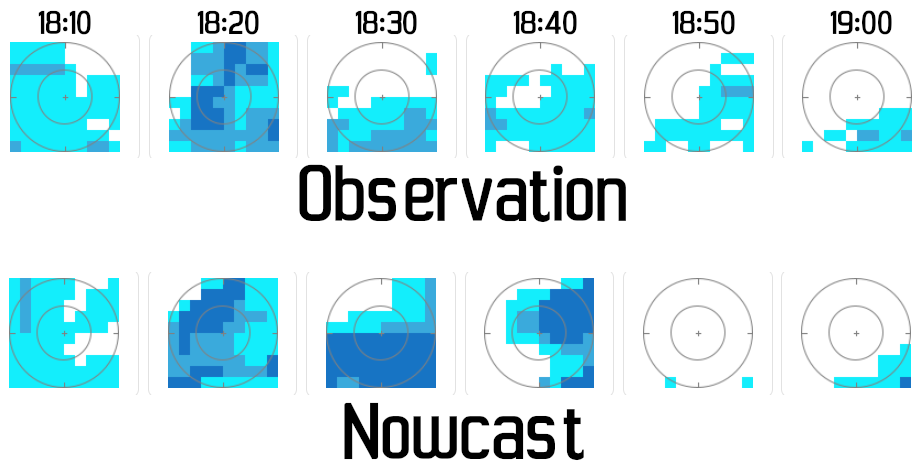
He adds: “First of all, this system calculates a movement vector – some little arrows showing where rainfall will move towards. The arrow length shows intensity and velocity. Once this is calculated, it applies it on the latest image you feed it with. And that’s its reference for forecasting the six following images”.
According to the main person in charge of developing this tool, the extrapolation method was chosen since it produced more accurate results (up to 85% of trustworthiness) than Eulerian persistence, a simpler reference method.
Right after all this – and having the images in dBR transformed into R (mm/h) – the best radar for each location in mainland Spain and the Balearic islands is selected. Both orography and distance to the radar are key factors when choosing the optimal radar for each location, provided that some locations may be covered by several AEMET radars.
At this point, only generating the Próxima Hora diagrams is left to be done, the ones users will see on their screens. The resulting “rainfall radar” shows a 50 kilometre radius from the chosen location, represented in the centre of the image.
The whole process takes “2-3 minutes, maximum”, Cuadrado points out.
The physicist remarks all this is based on his colleague Antonio Perez’s Master’s Dissertation Short-term rain forecasting using deep-learning techniques.
As it happens with all meteorological forecasting tools, this is not infallible. “For instance, sometimes it’s raining and it’s not showing in our tool, because the radars themselves don’t detect the rain”, Cuadrado says, in reference to drizzle. However, some other days, the longer-term numeric model forecast is not forecasting rain but Próxima Hora detects it allowing you enough time to react, pack your picnic and leave before the storm arrives.
Now that you already know how Próxima Hora works, would you like to give it a go? Our app is free of charge, ad-free and it doesn’t collect user data. You may download it here.