La predicción meteorológica es un mercado en expansión. Se prevé que crezca de los 1500 millones de dólares estadounidenses en 2020 a los 2300 millones en 20251. Las predicciones, especialmente aquellas a medio plazo, proporcionan información muy valiosa a compñías privadas e instituciones públicas y les permite prevenir los daños que provocan las olas de calor, las lluvias torrencial o los vientos extremos. Sin embargo, mantener un servicio de predicción meterológica es una inversión que suele competir en la propia organización con otras prioridades internas y recursos. Por ello, en este post queremos hablar sobre cómo cuantificar el valor económico que aporta una predicción meteorológica.
¿Cómo cuantificamos el valor? El modelo coste-pérdida
Al enfrentarse a una predicción meteorológica, muchas de las personas responsables de tomar decisiones se enfrentan generalmente a decisions binarias: o toman una medida de protección o no hacen nada. Esto es habitual en muchos campos profesionales: agricultura, aseguradoras, energías renovables o reducción de riesgo de desastres. Independientemente de si la predicción acierta o falla, todas estas decisiones tienen un coste asociado.

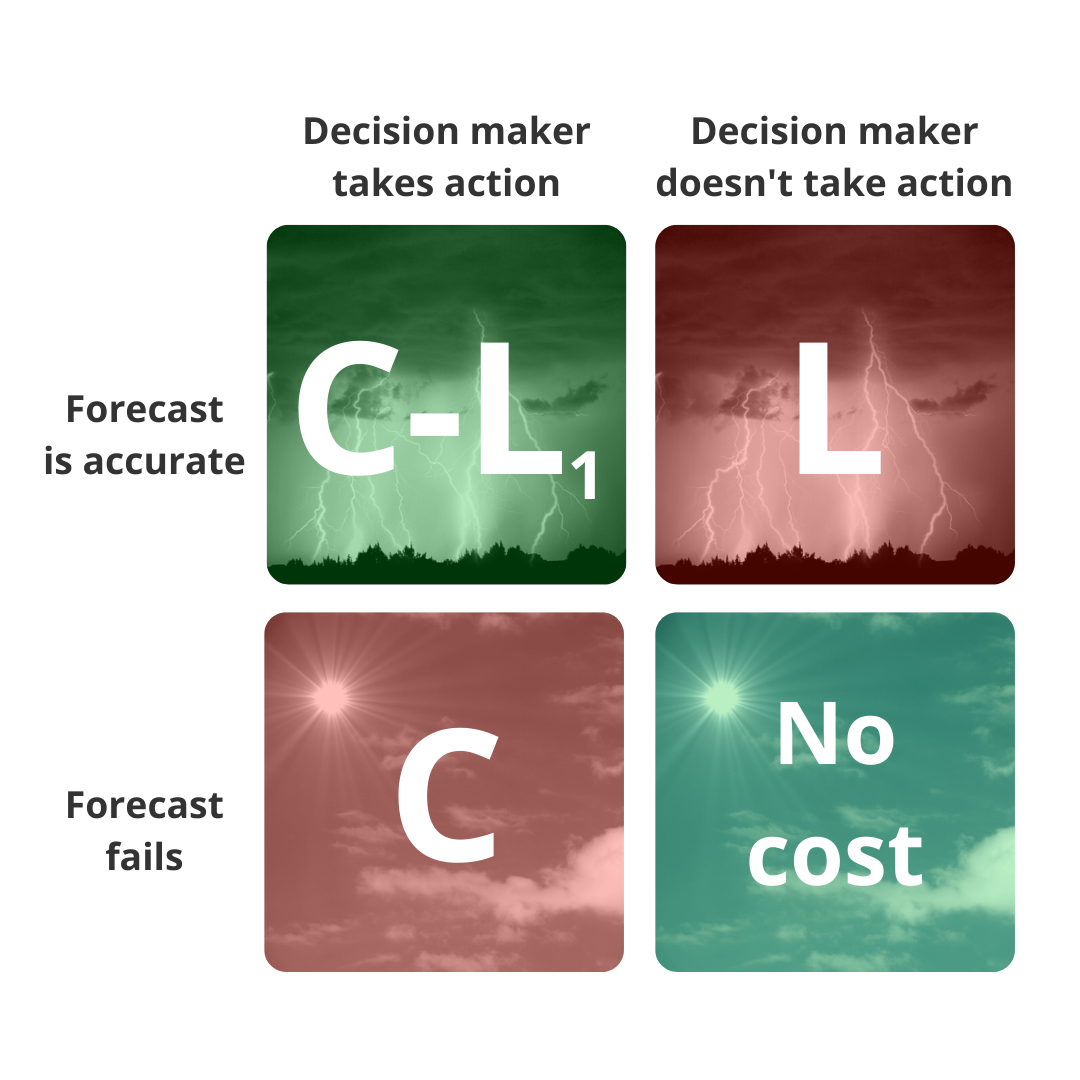
Imaginemos un comité de emergencia, formado por responsables políticos y servicios de emergencias. Sobre la mesa hay una predicción meteorológica, con niveles de precipitación que podrían dar lugar a inundaciones. Dependiendo de la decisión que tomen y qué ocurra en la realidad, existen diferentes escenarios, como ilustra el diagrama de arriba:
- Toman medidas preventivas y no hay inundación: ha habido un coste C.
- No toman medidas preventivas y la predicción es correcta: las inundaciones causan una pérdida de L.
- No toman medidas y la predicción falla: evitaron el coste de tomar medidas, y tampoco hay pérdidas.
- Toman medidas preventivas y sucede lo que predijo el informe: tomar medidas tiene un coste C, y evitan una fracción de las pérdidas, L1.
Este enfoque es el modelo de coste-pérdida2: se trata de un modelo que explica cómo la probabilidad de que ocurra un evento adverso afecta en la toma de decisiones. Para muchos resonsables, el ratio coste/pérdida (C/L) es el parámetro más relevante, ya que es el parámetro usado en los análisis de coste-beneficio a la hora de decidir si actuar o no. Si C/L es menor que la probabilidad de que el evento adverso suceda, en muchos campos los responsables son partidarios de actuar.
Tal y como veremos más adelante, justo este ratio es uno de los dos parámetros más importantes a la hora de determinar el valor económico de una predicción meteorológica.
Qué tipo de predicción encaja mejor: ¿determinista o en conjunto?
Para cuantificar el valor de una predicción, en primer lugar hay que elegir el tipo de predicción. To quantify the value of a forecast, first we have to establish which type of forecast we are talking about. If you compare the weather forecast provided on TV with the tailored forecasting that we provide, you’ll spot an immediate difference. The weatherperson on TV provides only one number: tomorrow it’s going to be rainy, with precipitation of 10mm over the next 24 hours. It’s what’s called deterministic forecasting. However, this is hardly useful for many decision makers. It paints a black or white picture that is not realistic at all, as it gives no information about the certainty levels of the prediction.

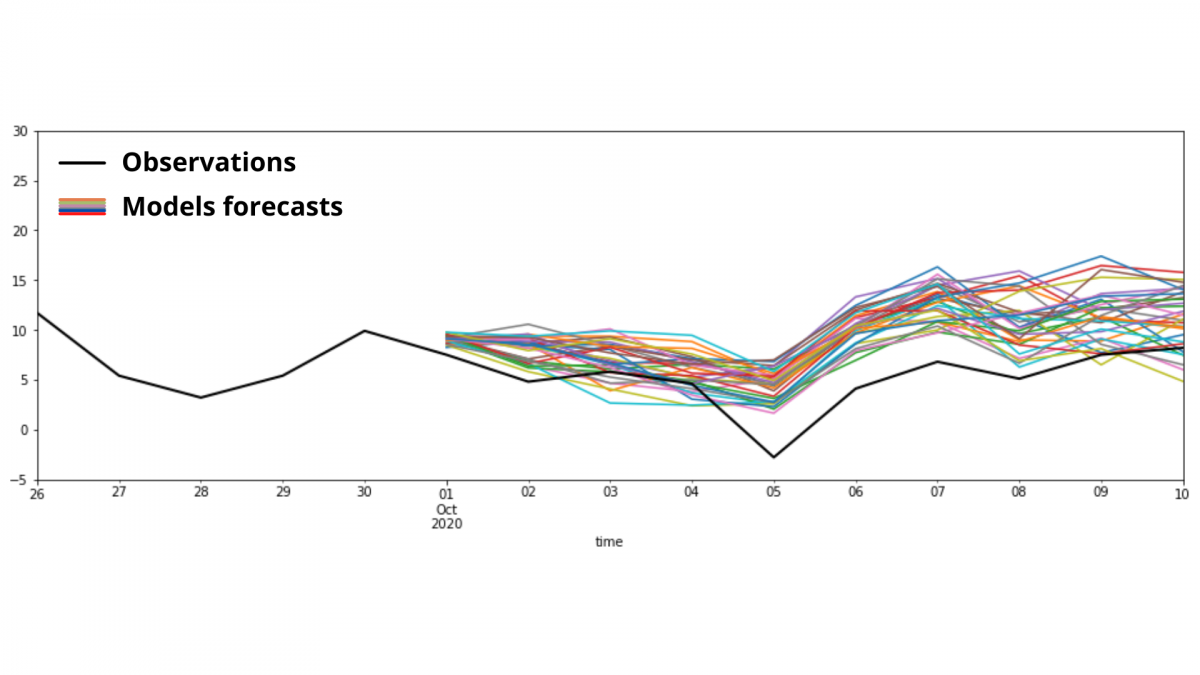
For decision makers, weather reports usually come in the form of ensemble forecasting: a set of different configurations of a weather model (or different sets of models), that provide an array of forecasts. The result is that each variable is accompanied by its probability. For example: tomorrow there’s a 30% probability that the precipitations levels are between 1 and 5mm, and a 40% of falling between 5 and 10mm. As such, an ensemble of forecasts offers multitude of decision levels. Compared with the single yes-or-no decision based on the deterministic forecast, decision makers relying on ensemble forecasting take a much more refined approach to the task at hand.
The key lies in establishing a threshold for the probabilities associated to weather events. To put it in context, let's go back to the imaginary emergency committee in the first section. They were worried about a weather forecasting of heavy rains that may cause flooding. There are two parameters at play in this scenario:
- What constitutes "heavy rains"?
- At what probability threshold does the committee take action? 10%, 20%?
To answer these questions, a close collaboration between us (the weather modellers) and the decision makers is required, as these thresholds are not a fixed thing. They vary across professional fields and locations. For example, emergency responders and city managers have different definitions for “heavy rain”, and the precipitation levels that in a city do not constitute a flood risk for one city, become a source of worry for another (because of their sewage and draining system, for example).
A matter of skill
When offering an ensemble forecasting service, the question that we ask ourselves most is ‘How certain are we of the forecast?’. Luckily, this question has a measurable answer.
For each type of weather, we can run the weather model for past events, to calculate the skill. The skill of a model is a measure of the superiority of a forecast over a simple historical baseline of past observations. It’s a metric that tells us how reliable this forecasting method has been in the past for specific weather events.
It’s important to highlight that the same forecasting methodology can result in different skill scores, depending on the location, configuration of the model and specific weather event to monitor. That’s the reason why, we usually ask three questions to our clients:
- Which weather event are you worried about? Winemakers worried about late frosts, hydropower facilities looking to manage better dry spells or metro underground facilities avoiding ice on the catenaries. Each company faces different challenges, and each sector has its particularities.
- Where should we provide the forecast? The skill varies across different locations. Depending on the geography of the area, and local climate peculiarities, models can be more or less accurate.
- When should we provide it? Even for the same place, skill can vary across seasons (e.g., spring weather might be driven by erratic local conditions, whereas winter cold snaps might correlate with observable polar winds).
Starting with these three questions, we can perform an initial study that assesses the fitness of the forecasting service to the particular situation, and get a skill score. Because skill, together with the cost-loss ratio we spoke about on the first section, is the other parameter that defines the value of the forecasting service. Only a skillful forecast has value.
So, is ensemble forecasting worth paying for?
Remember the loss-cost model on the first section? That same model can be applied to ensemble forecasting, to compare its value to that of an ideal deterministic forecast. The result is that, if the ensemble forecasting is skillful, the economical value for a specific forecast depends only on the cost-loss ratio. For example, using the ECMWF’s ensemble prediction system (EPS), this study used the cost-loss model to calculate the value it offers in precipitation events of 1, 5 and 10 mm. In this case, the ensemble projection provides value for every user, although it provides more value for those users with cost-loss values that are in the middle (nor too high nor too low).
Similar studies are performed regularly for differen ensemble forecasting services, and different weather events. And these same calculations can be applied to specific users. All you need is to know the specific weather that you want to forecast, know if the forecasting is skillful for your case (that’s the preliminary study we perform in all our forecasting services), and the cost-loss ratio of taking preventive measures. Usually, ensemble forecasting is worth paying for, providing value over deterministic forecasts. The best thing is that its value can be quantified.
Further reading
If you found the article useful and want more information on the matter, please take a look at this external resources:
[1] Weather Forecasting Services Market by Industry - Global Forecast to 2025. Link
[2] Cost/loss model and the relative value Link
Zhu, Y., Toth, Z., Wobus, R., Richardson, D., & Mylne, K. (2002). The economic value of ensemble-based weather forecasts. Bulletin of the American Meteorological Society, 83(1), 73-83.Link
T. N. Palmer (2002). The economic value of ensemble forecasts as a tool for risk assessment: From days to decades. Q. J. R. Meteorol. Soc. (2002), 128, pp. 747–774 Link
