As a spin-off company from the University of Cantabria, research and innovation lies at our very core. That’s why we are starting a new series of posts: Predictia Papers. We want to display our academic side, explaining some of the papers in which we have participated. We hope you enjoy it!
If you were to bet your money on the weather, how would you place your bets? For people working in wind energy, this question is far from hypothetical. On a day-to-day basis, windmills rely on weather conditions to work. And as wind energy power plants are exposed to all sorts of climate risks, it is key to have medium-term projections to prepare in advance. In this first post about #PredictiaPapers, we want to talk about this last case of medium-term projections and we will delve deeper into how climate projections can help to estimate quarterly production and revenues, one month in advance. Hang on till the end of the article if you want to play around with an app we developed to explore the advantages of having accurate medium-term information.
Want to go directly to the scientific paper? Go to “The Weather Roulette: a game to communicate the usefulness of probabilistic climate predictions.”**
Climatology: using the past to predict the future
Typically, to guess what the climate conditions will be in the upcoming months, wind energy providers and managers rely on historical records of climate. Nowadays, through remote sensing, satellites and in-situ measures taken by radar, land station and radio sondes, we have access to systematic climate records, with an unprecedented level of detail. A good example of this is the ERA5 data provided by Copernicus: a climate data collection spanning from 1979 up to five days ago. And it delivers an astounding amount of information. It covers the Earth with a grid of 30 Km resolution, and divides the atmosphere in 137 levels from the surface up to a height of 80km. In addition, it provides over 250 atmospheric, land and oceanic climate variables.
Using these type of historical datasets, at Predictia we provide energy traders, wind energy managers and other professionals valuable insights and estimations on what to expect in the upcoming months. We analyse historical records and use statiscal techniques to compare them to the present day, to project what are the most likely scenarios to be for the next season. This approach is called climatology, and it provides answers to questions such as:
- What are the probabilities of being above or below normal wind conditions for the next season?
- What are the probabilities of extreme winds that may hamper the wind energy production?
- How are the energy outputs levels most likely going to be?
Although they are really useful, these climatological predictions rely on a key assumption: that what happened in the past is representative of what will happen in the future. In a changing climate, where future climate trends are expected to differ from the past, relying on past data to forecast future behaviours is expected to become less and less accurate. That’s why in the last few years, we are also applying another approach that is gaining traction.
Increasing the chances: modelling the climate for better results
Fortunately, we now know enough about how the atmosphere works to implement physical models that simulate the inner workings of the atmosphere. Products such as the ECMWF System 4 seasonal forecasting system run ensembles of models, providing projections on what the weather is most likely going to be in the upcoming months.
However, as models are not the reality, we need to measure the degree of reliability of the projections they offer. This is the skill level: a comparison between the model projections for past years and the actual observations, that provide a measure of the degree of accuracy of the model. This skill level is not homogeneous throughout the globe. There are regions where the models work better than others, due to climate processes such as El Niño–Southern Oscillation, that affect the model variability.
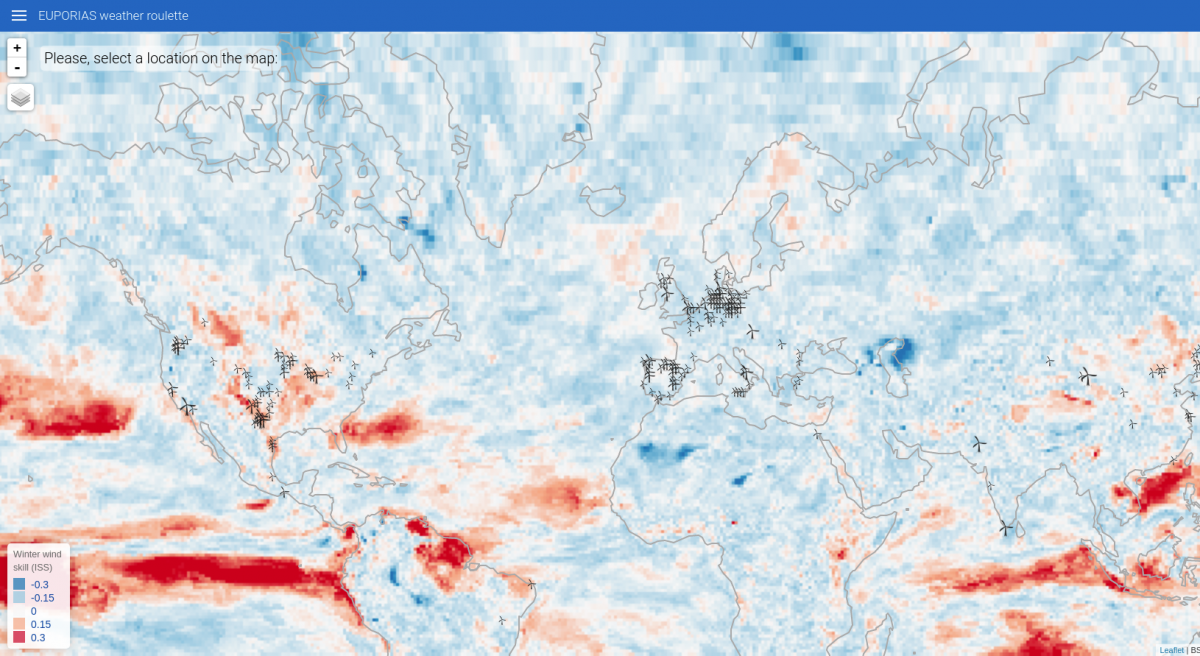
So, it is important to consider not only the projection as a stand-alone product, but to accompany it with the level of skill. In that way, the final user can have a more accurate picture, and filter the information taking into account its accuracy.
Climatology vs. modelling: which one works better?
There’s an app to answer this question. It’s called EUPORIAS Weather Roulette, and we developed it within the H2020 project EUPORIAS. It’s available at the Google Play Store, so feel free to install it and give a go!
With it, we wanted to communicate in a clear way the Return of Investment that climate predictions can provide, when compared to the climatological predictions. The game is a simple one:
- Explore the map to see which areas have a higher skill score.
- Select one location to take your chances.
- Do you want to play for a single year? Or do you want to start with an initial bet and invest over 33 years?
- Do you want to place your money on climatology or on the model?
The bet is spread proportionally to the predicted probabilities provided by the model or the climatology (above-normal, normal, or below-normal wind speed conditions for the next season), and compared with the observations. You only win the amount of money placed on the category that was right. In the end, you get the result of how much you would have won or lost using climatology or models as a base for your bet. A little tip: if you bet for models in a location with high skill… you won’t regret your decision!
This is just an example on the kind of information that climate projections can provide the energy sector. If you want to start taking data-based decisions, contact us! We’ll be glad to explore with you different solutions for your particular needs.