
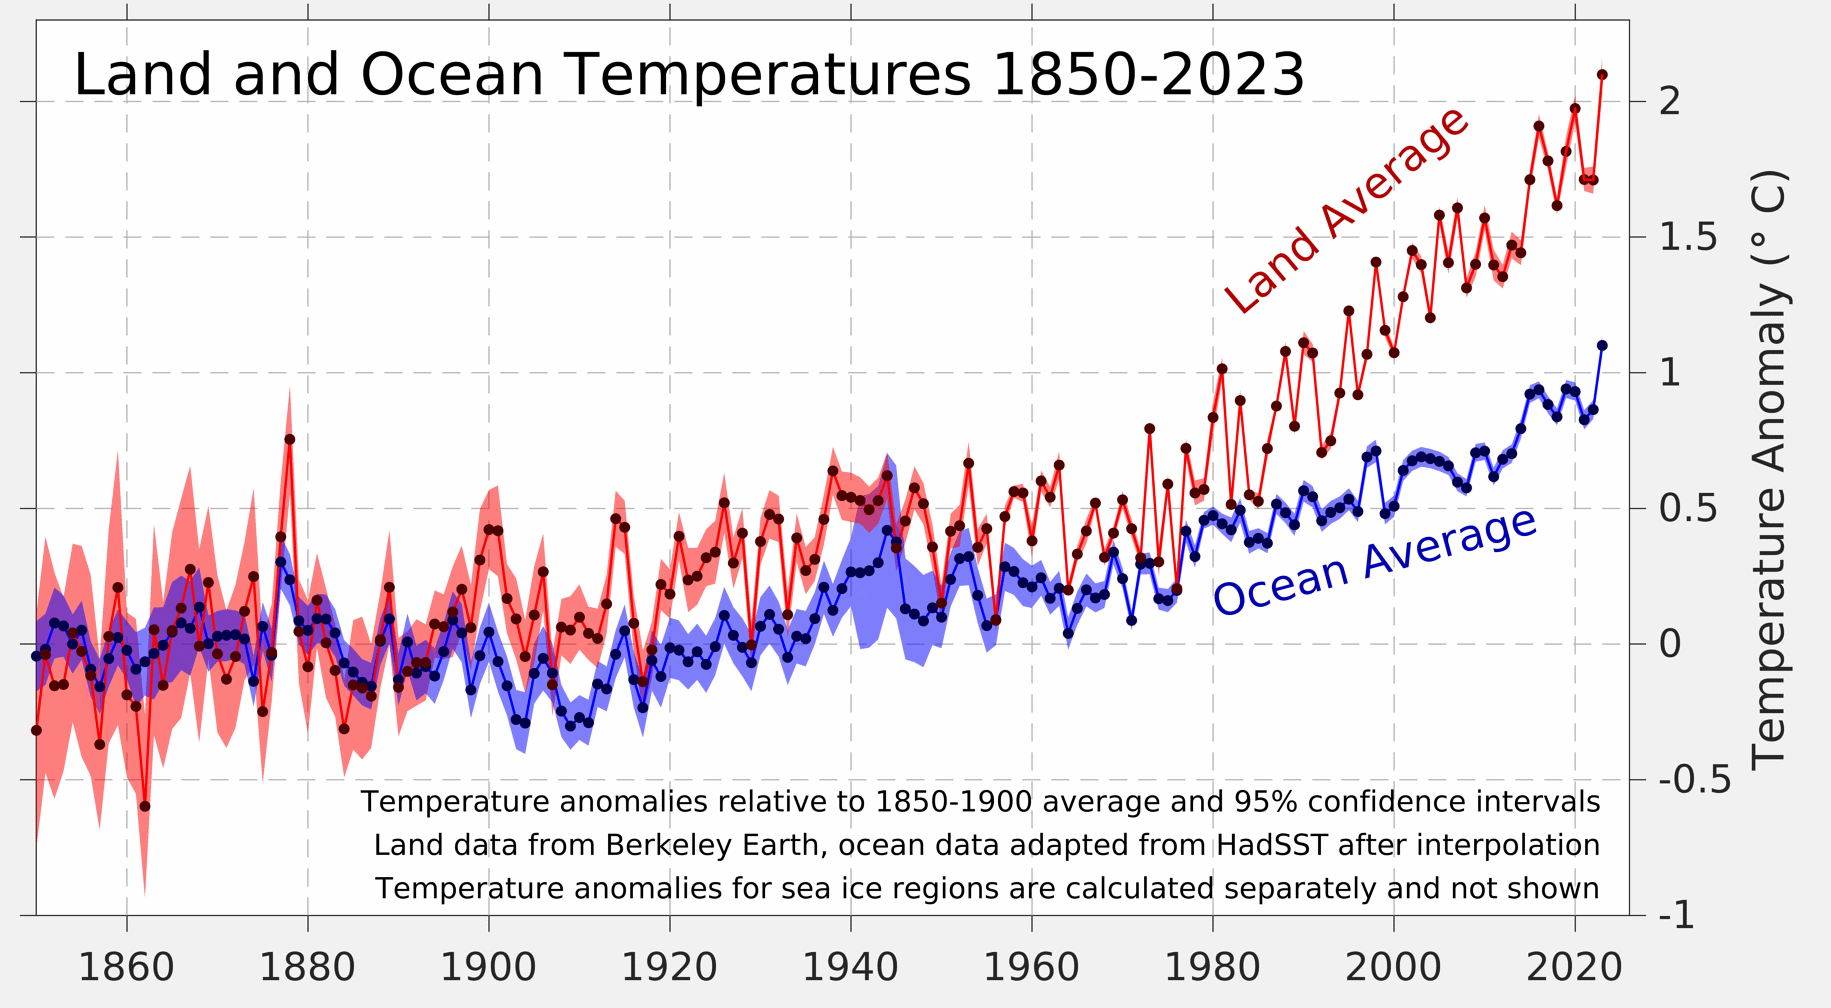
The World Meteorological Organization confirmed on Tuesday what had been pointed out by several major institutions in the field: 2023 has been the warmest year on record globally – at least in terms of sea and earth-surface temperatures. We've tried to put the case of mainland Spain and the Balearic islands into context.
But what happened in Spain during 2023? What can we expect from now on? We thought this may need a little bit of context, so we resorted to ERA5 reanalysis data from the Copernicus Climate Data Store in order to calculate a few figures such as the following, covering mainland Spain and the Balearic islands. In our country 2023 is the second warmest right after 2022.
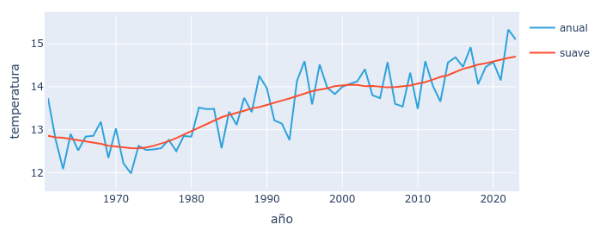
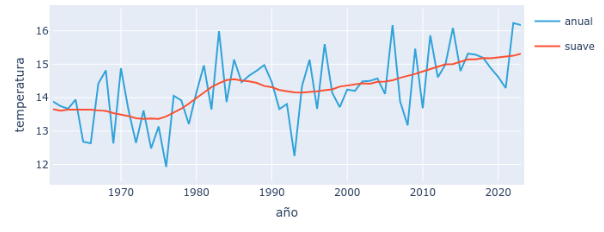
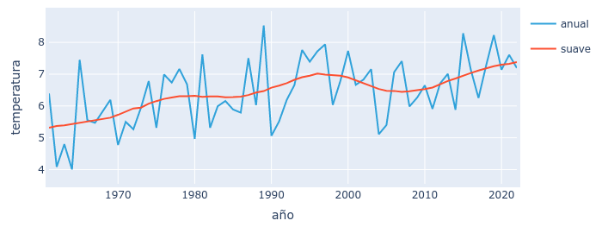
As can be seen in Figure 1, 2022 and 2023 were the warmest in the series. It can also be noticed how temperature has been on the rise over the past few decades (in orange) and its yearly variability (blue). How do these two pieces of information relate to each other over the long term? Are we to expect any more cold years? Will they all be warm from now on? How does global warming affect the different seasons?
Questions are building up, so let’s start clarifying some of them: 2023, as in the case of 2022, has been an extraordinarily warm year. However the magnitude of that anomaly depends on the benchmark.
That’s why we’ve drawn a smoothed series using a fifteen-year wide moving window with Gaussian weights with a standard deviation of four years. The outcome is a smoothed series (in orange) with an ascending trajectory featuring some long-wave oscillations. This means sometimes cold or warm years tend to group. This may be as a result of known causes (such as it happened after the Pinatubo eruption in the Philippines in June 1991) or to other sources of natural variability.
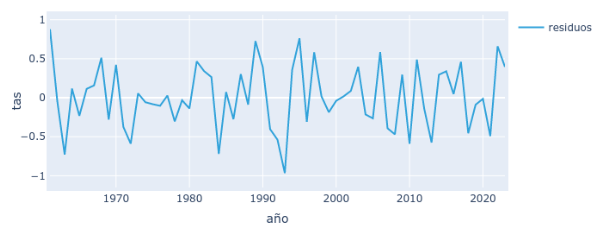
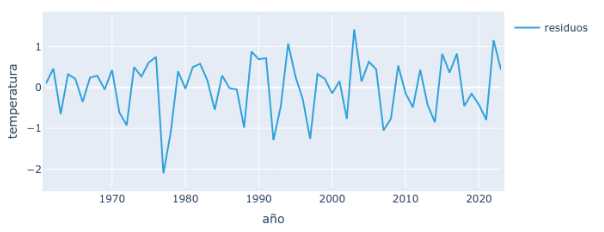
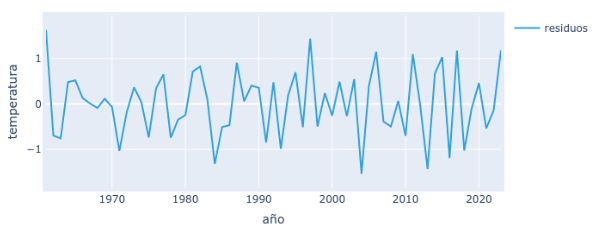
In this way we can break down the series into two separate elements: the smooth curve showing the evolution of the climate (the average temperature in the long term, in orange) and the remainder obtained by subtracting the smooth curve from the original series. In the case of annual temperature in Spain, it can be see on Figure 2 how the residuals feature several over ±1 degree oscillations compared to the average of their time, while the annual smoothed average temperature has increased by two degrees since the early 60s until today (Figure 1, in orange). This means the following: On the one hand, the trend towards warming clearly exceeds annual variability. On the other hand (and we’re answering some of the earlier questions here) is from now on it’s very likely the coming years will be warmer compared to previous decades and record-breaking temperatures will become the new normal.
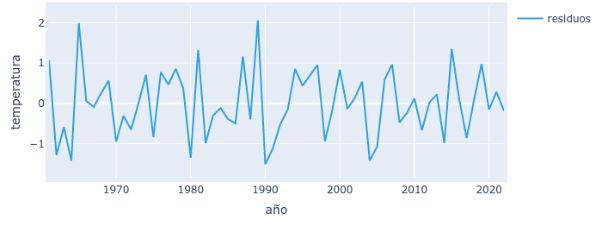
Besides, as it can be seen on the following Figure (2), 2022 and 2023 feature as warm years, but they’re hardly the warmest when compared to 1989 or 1995, extremely warm at the time.
Therefore we should stress two concepts before moving ahead to analyse each of the (meteorological) seasons:
Warm temperatures as experienced in 2022 and 2023 will become normal, as we’re already in a warmer climate compared to the 60’s, as shown by the smooth curve on Figure 1. *Footnote: We’re referring to data on Mainland Spain and Balearic islands, and only taking into account earth-surface temperature. Do not mistake this with the Paris Agreement goal of keeping the rising global temperature beneath two degrees Celsius compared to preindustrial levels by the end of the 21st century. Global temperature also comprises oceans, warming at a slower pace than earth surface, so the global warming is lower than just the earth's surface. Rising average temperatures in 2022 and 2023 can be attributed to greenhouse emissions, as illustrated in a wide array of publications, such as those by the UN’s Intergovernmental Panel for Climate Change.
Winter is the most variable season
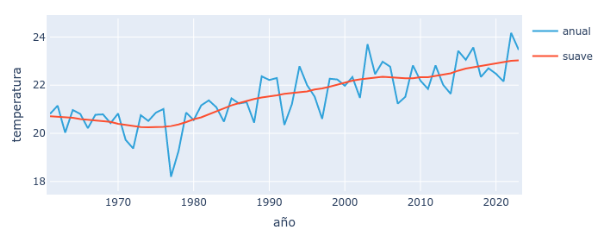
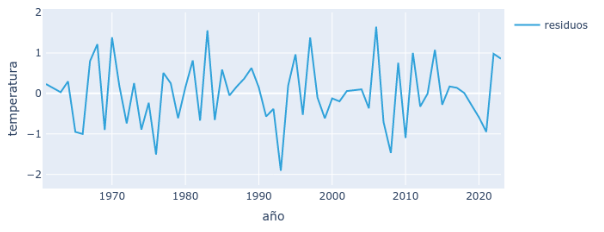
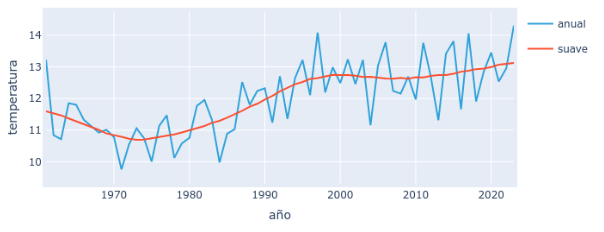
Let’s break it down to the different seasons and let’s start with summer. It follows a similar pattern to the annual average ones, with a prominent warming. What to pay attention to? The exceptionally cold summer of 1977 and the very warm one in 2003.
This said, summer of 2022 surpassed 2003 by a large margin in absolute terms despite its deviation from the smooth curve is smaller (Figure 4), because of the unrelenting warming due to greenhouse emissions as a consequence of different human activities.
We encounter a higher inter-annual variability in autumn. However, the trend towards warming features clearly here as well. Autumn 2022 and 2023 were the warmest in the series (Figure 5), despite being less abnormal compared to the smooth curve than those of 1983 and 2006, among others (Figure 6).
In spring we can see again how 2023 constituted a new high because of the trend, although higher anomalies can be found in the diagram compared to the smooth curve.
And we made it to winter! It’s undoubtedly the season with the higher inter-annual oscillations, linked to the North Atlantic Oscillation.
The most incredible occurrence here is the warm 1989-90 winter (two degrees above the average of the time!) or super cold winters of 2004-05 and 2005-06. It’s important to remark that winter weather will keep happening. However, in the long run the trend keeps rising and it’s very unlikely we’ll see winters such as the cold ones registered in 1962-63 and 1964-65 ever again.
If you liked the topic, you may explore similar stories in our blog.
And in case you'd like to learn more, don’t hesitate to reach out to us via e-mail at predictia@predictia.es.