
In a context of growing global awareness and concern about air quality, several governments are implementing green policies to reduce pollution levels in urban areas. The city of Madrid, one of Europe's most populous capitals, has an extensive road network and 4.2 million registered vehicles, which translates into congestion problems and poor air quality, directly affecting human health..
In recent years, two events have significantly reduced traffic in the city of Madrid: the implementation of Madrid Central (a low-emission perimeter) and traffic restrictions due to the COVID-19 pandemic. Taking advantage of this experimental framework, a series of simulations were carried out using machine learning techniques to test the influence of weather conditions on the reduction of traffic pollution.
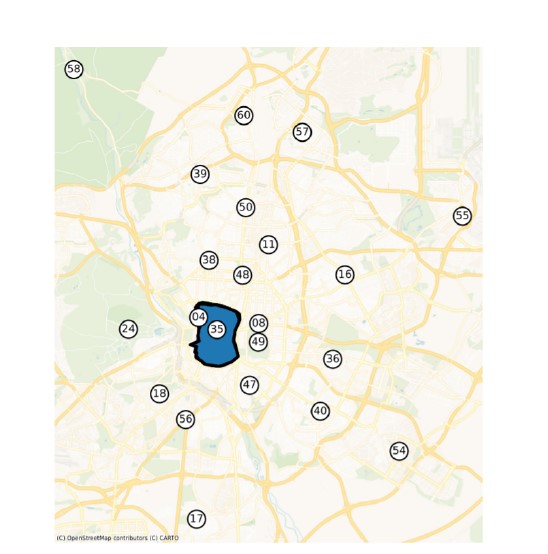
The aim of this study is to quantify the influence of traffic and meteorology on air quality in the city of Madrid (Fig. 1), taking advantage of the experimental framework provided by the two aforementioned events, with the aim of trying to prove that in order to evaluate the efficiency of measures involving a traffic reduction, it is necessary to take into account the fundamental role played by meteorology.
Methodology
For this subject, air quality, traffic and meteorological data provided by the Madrid City Council and the company Predictia Intelligent Data Solutions were required. Once the data was processed, it was subjected to an exploratory analysis to determine the presence of outliers and whether these were due to high pollution episodes.
Four datasets including traffic, pollution and weather information were created for the following areas of Madrid:
- Zone 1: Retiro.
- Zone 2: M-30.
- Zone 3: Casa de Campo.
- Zone 4: Plaza del Carmen (Madrid Central).
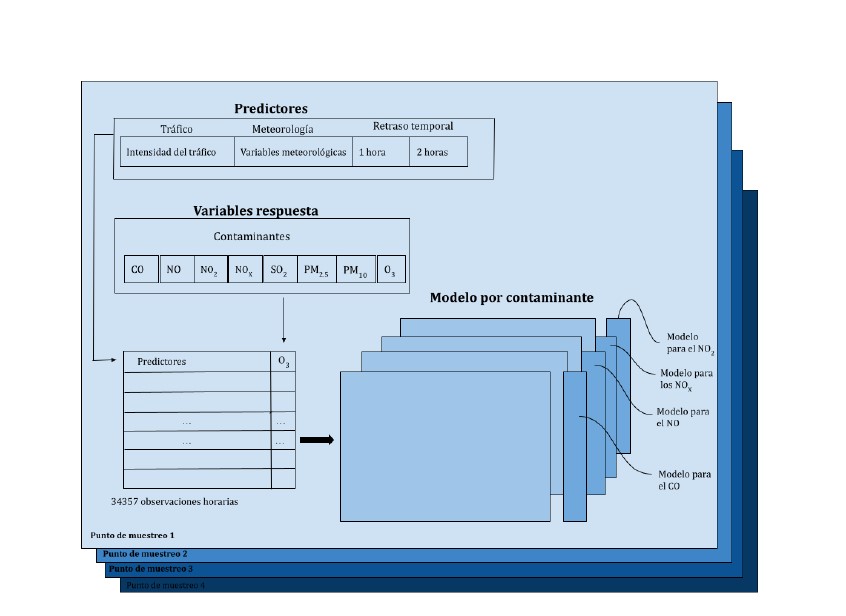
In order to study the relationship between different pollutants, traffic and meteorological variables, a key aspect was considered: the persistence of these factors in the atmosphere. For this reason, two time delays of one and two hours were applied to all predictors (traffic and meteorology) in each of the data sets. Figure 2 illustrates the structure of each dataset.
Nitrogen oxides (NOx = NO + NO2) have a correlation of about 0.5 with traffic, while carbon monoxide (CO) shows a correlation of 0.3 at every single sampling point, it was observed.
On the other hand, ozone (O3) is strongly correlated with meteorological variables related to solar radiation. Particulate matter (PM) is also related to traffic, although it is more closely linked to industry and the use of heating systems. Following this first analysis, the study focused on carbon monoxide and nitrogen oxides.
The second analysis focused on assessing the importance of the different predictors (meteorology and traffic) in relation to the pollutant level through machine learning techniques, particularly using Random Forest models. Random Forest is an algorithm based on the construction of multiple decision trees to improve accuracy and avoid overfitting by combining the results of each tree to make a final prediction. This analysis provided us with an initial estimate of which features are the most relevant for building a predictive model and which have limited influence, allowing us to eliminate them in later stages of modelling, thus optimising computational time.
Once the target variables and predictors were established, two models were generated for each pollutant at each sampling point (Fig. 2). The first used 2017, 2018 and 2019 as training data, leaving the year of pandemic onset (2020) for testing. The second model used the years 2017, 2018 and 2020 as training, leaving the year in which Madrid Central was implemented (2019) for testing.
To select the best modelling strategy for the final simulations, several data mining techniques were evaluated, including GLM, k-NN and Random Forest. GML is an advanced linear regression algorithm, while k-NN is based on the closeness of the data to its nearest neighbours. The decision tree-based technique, Random Forest, proved to be the most effective, outperforming the others on three key metrics: coefficient of determination (R²), root mean square error (RMSE) and ratio of variances.
Simulations
Once the best models for each pollutant at the different sampling points were identified using machine learning techniques, simulations were carried out to quantify the influence of meteorological conditions and traffic on air quality. Two types of simulations were performed: one for the Madrid Central period (2019) and one for the COVID-19 period (2020), using the validated models for those years. These simulations focused on Gran Vía, the only area that covers both periods of traffic reduction.
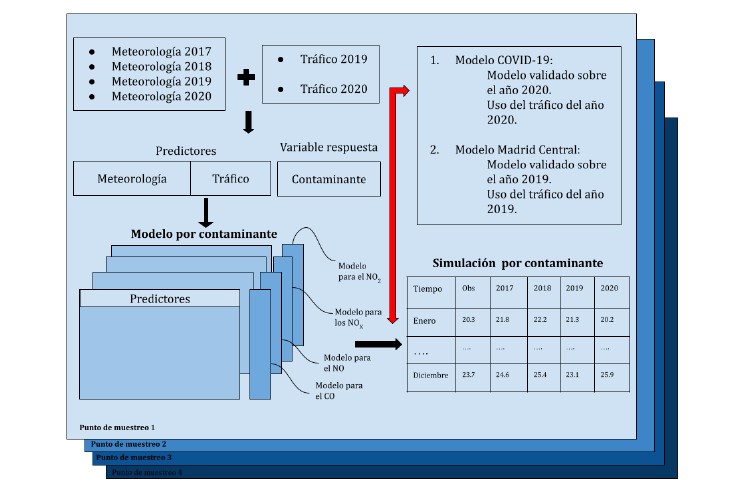
First, a dataset was generated by combining one year's weather data with traffic data for 2019 or 2020. Then, the corresponding model was applied according to the traffic used:
- COVID-19 model (validated with 2020 data).
- Madrid Central model (validated with 2019 data).
This process was repeated for each year (2017-2020), generating four simulations, each with the meteorological data of a specific year and the traffic data of one of the two events studied (Fig. 3). This allowed estimating how meteorological conditions, in addition to traffic, influence air quality.
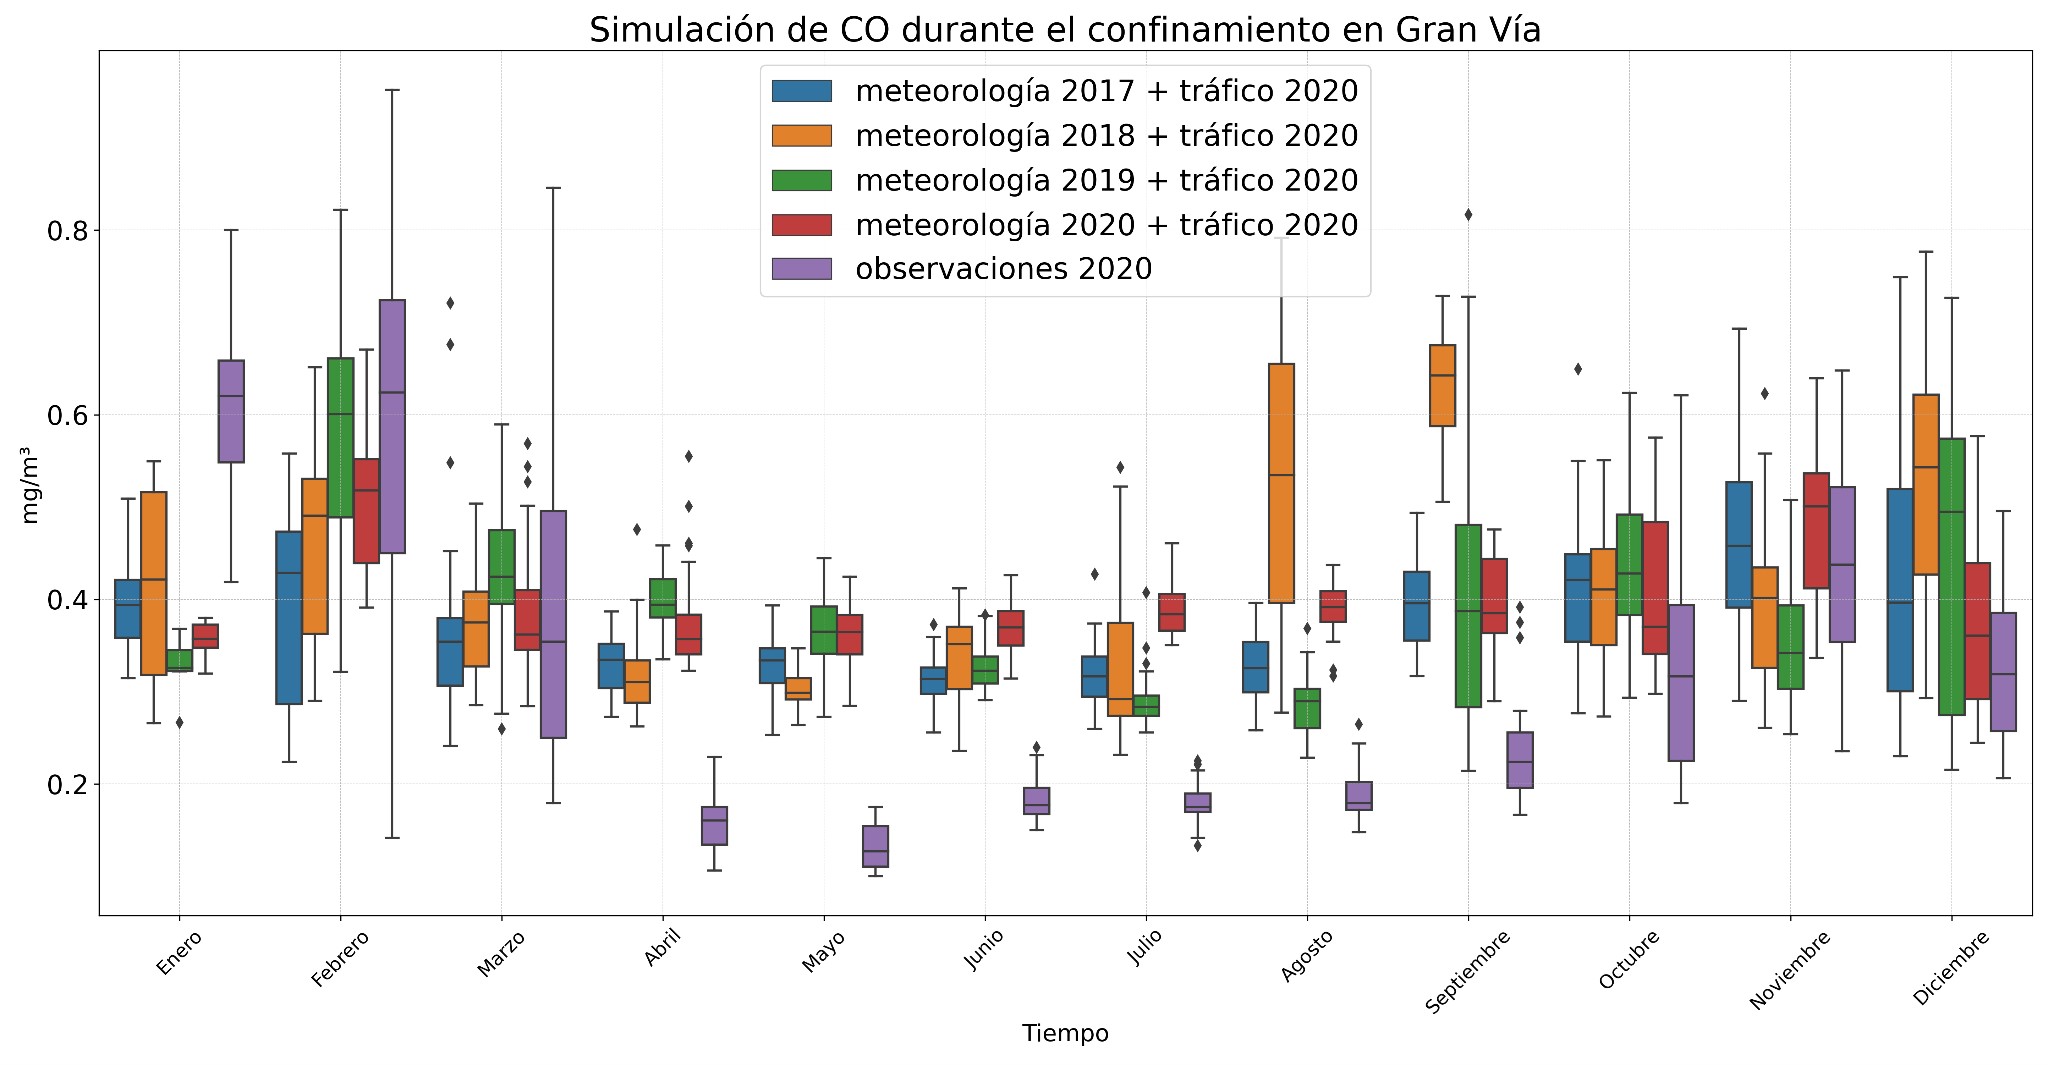
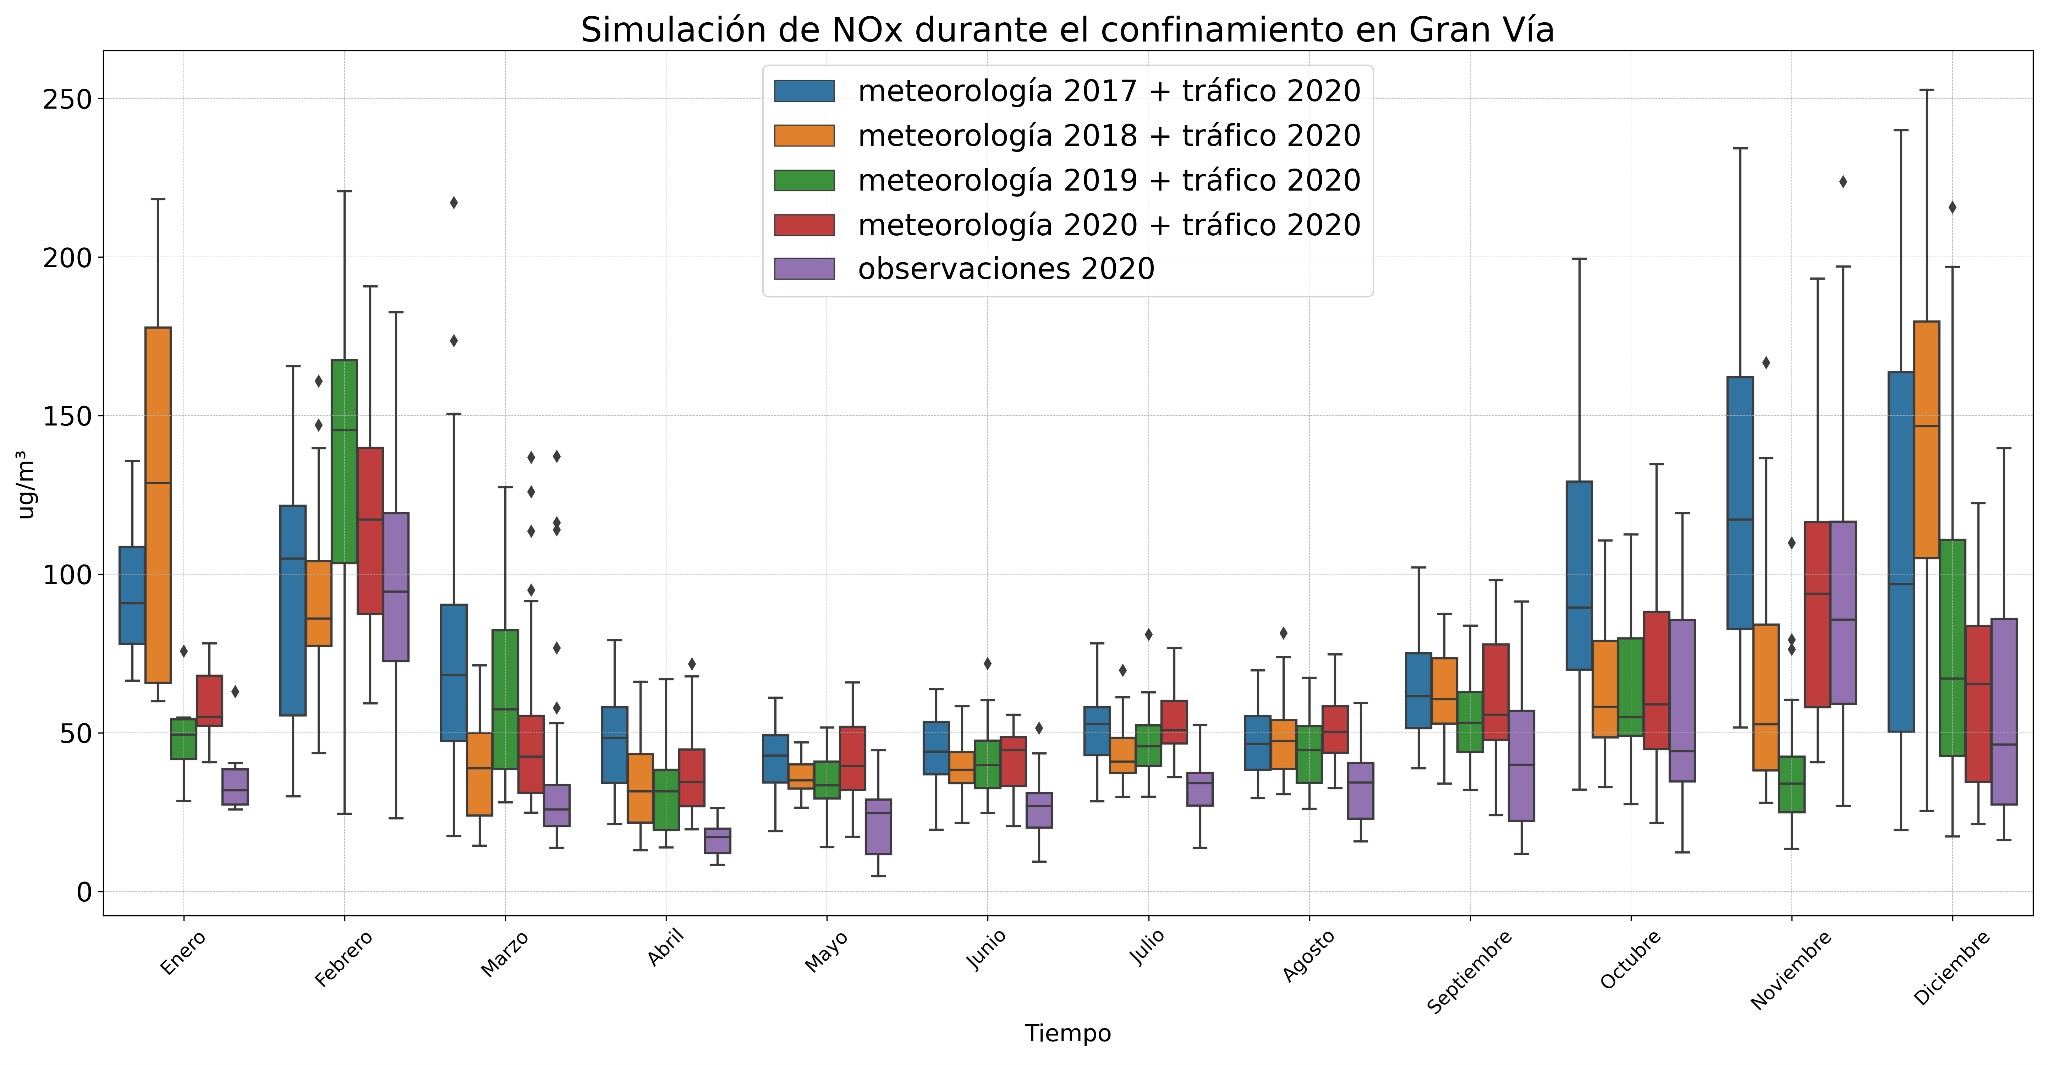
Figures 4 and 5 show the simulations for CO and NOx pollutants generated with the validated model for 2020. Some outliers were observed for CO due to construction works in Gran Vía, which made the predictions not fit the actual 2020 data so well. However, simulations for CO using other meteorological conditions showed higher values, especially in 2018, with a peak in August and September. On the other hand, simulations with meteorological data from 2017 and 2018 show a decrease in concentration in February and March, possibly due to weather events such as squalls clearing the atmosphere.
The NOx models better captured the variability of the data, showing an increase in levels during the winter months (December and January) when meteorological conditions changed, which could be due to the thermal inversion, which hinders the dispersion of pollutants. In summer, concentrations hardly varied at all.
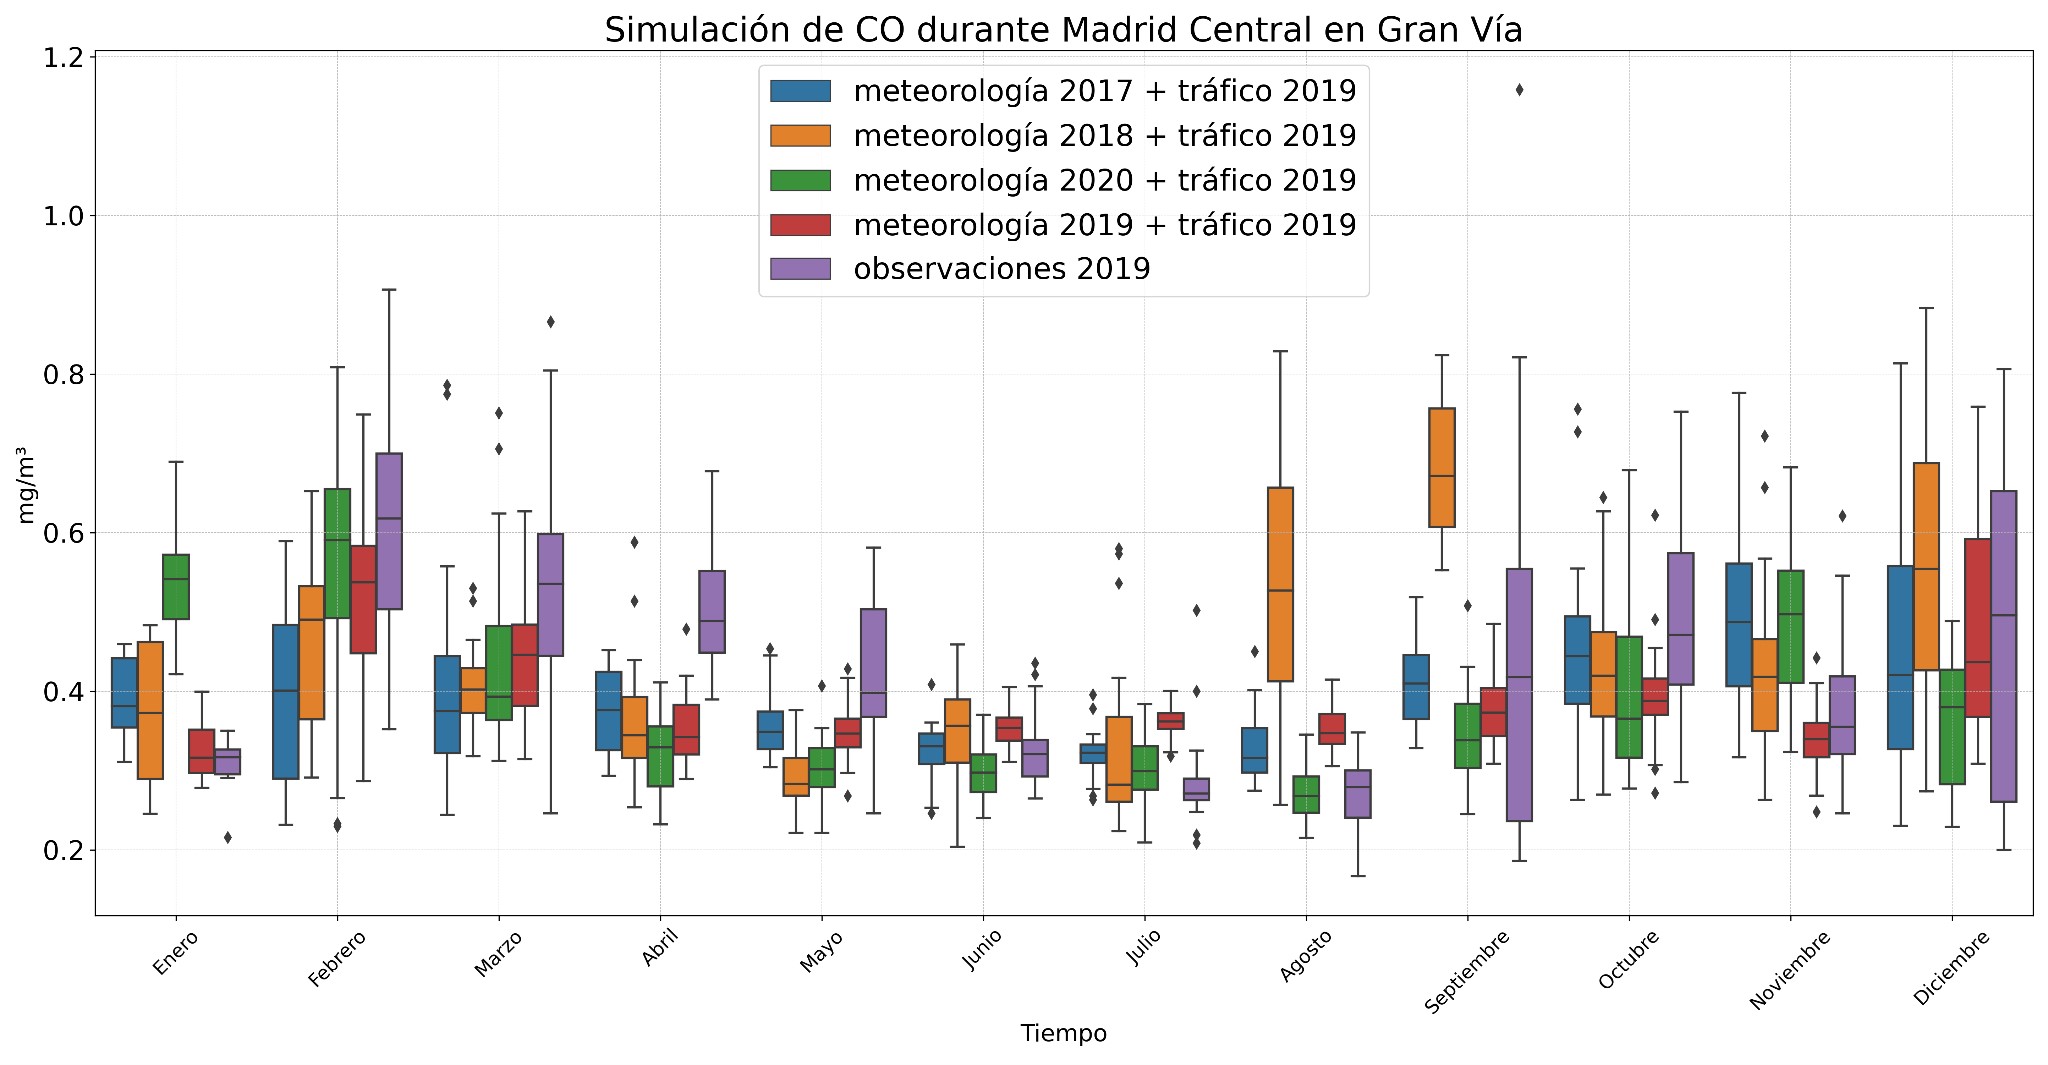
The second experiment applied the validated model for 2019 (Madrid Central) to new datasets, combining 2019 traffic with different weather conditions. When comparing the simulations generated with this model and those obtained with the 2020 model, the simulations of the 2019 model showed less variability. This is because the reduction in traffic in 2019 was not as drastic as in 2020, when there were restrictions due to COVID-19.
In Figure 6, it can be seen that the 2019 model better explains the CO variability, showing a concentration peak in August and September when combining 2019 traffic with 2018 meteorology, similar to the behaviour observed with the 2020 model.
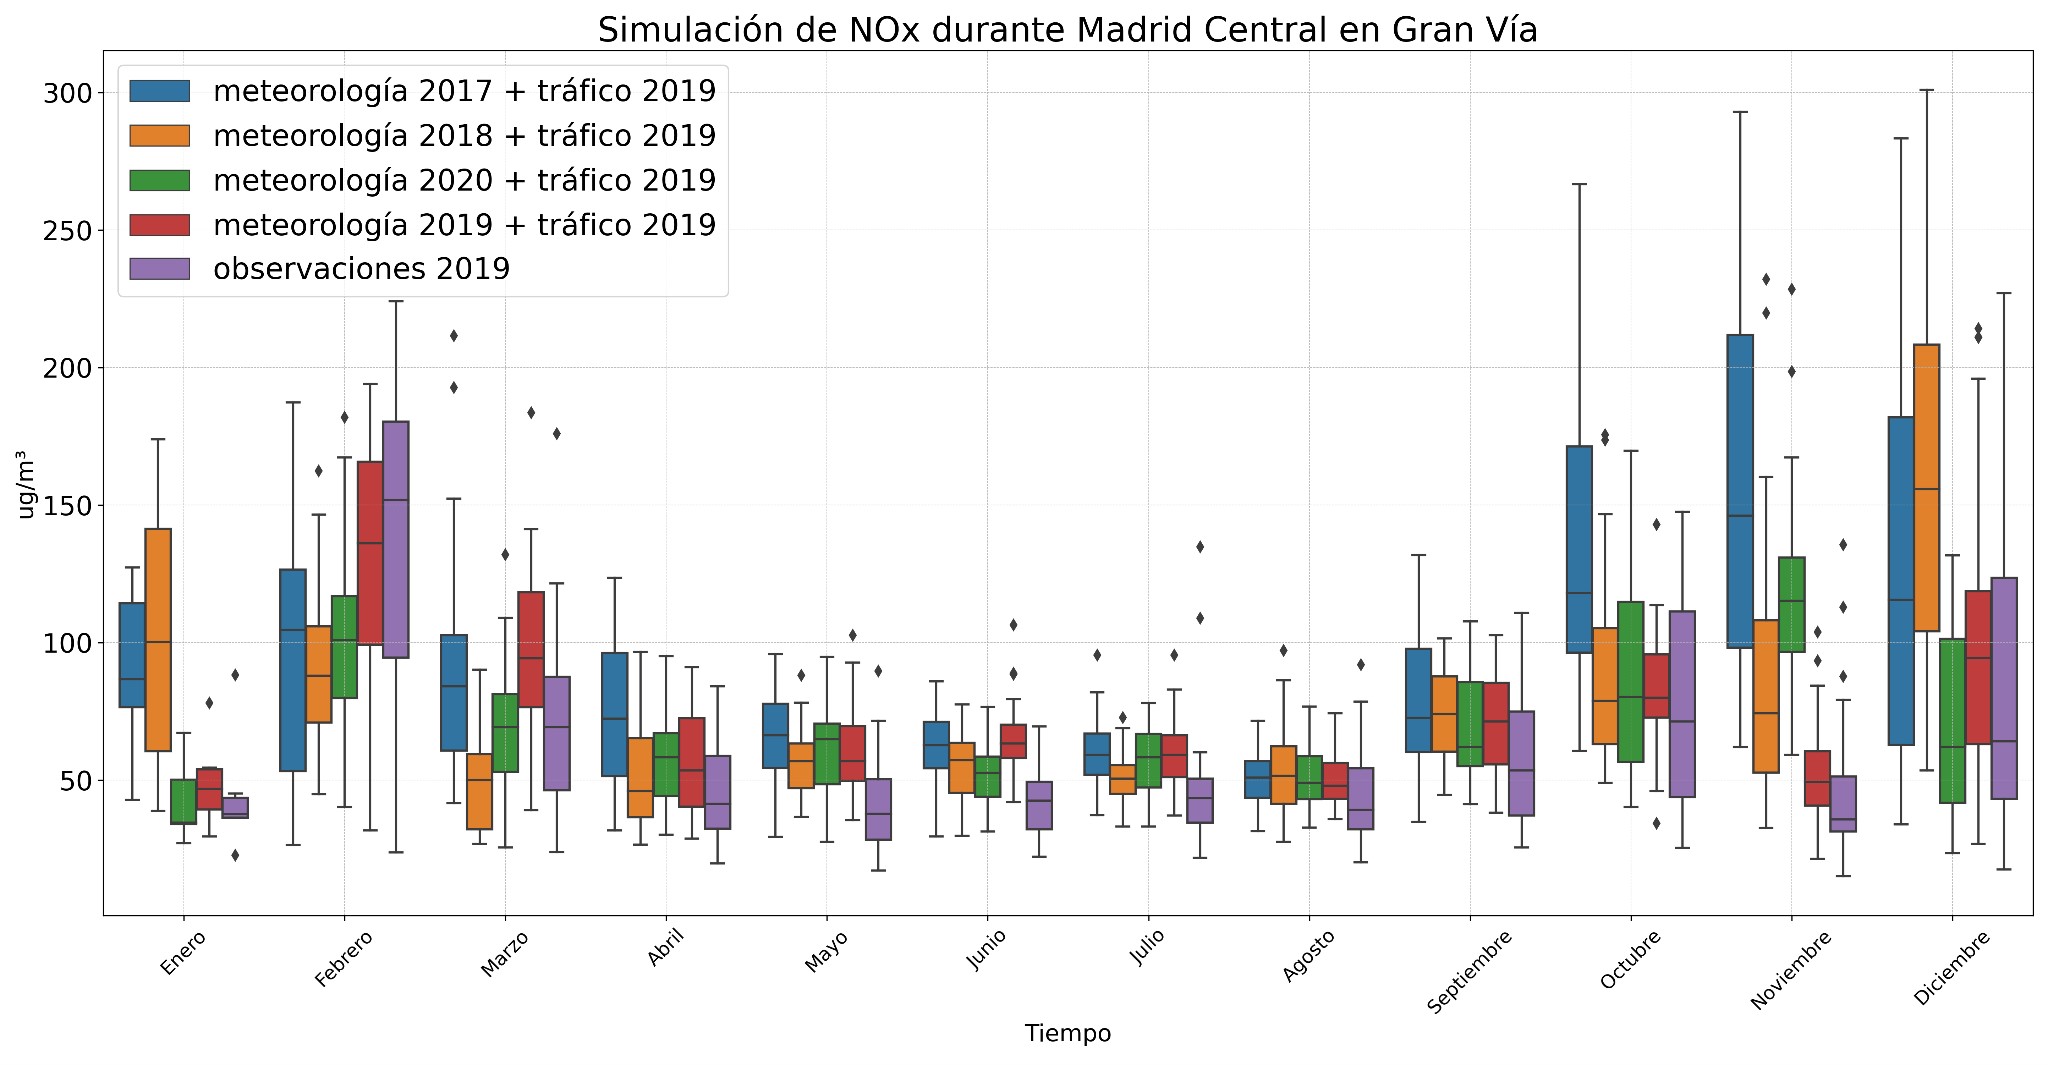
For NOx (Fig. 7), simulations with the 2019 model also better capture the variability of the data. When combined with different meteorological data, an increase in concentrations of these compounds is observed during the winter months, particularly in December and January, as shown in the graphs above. In summer, concentrations of nitrogen compounds hardly vary at all when meteorological conditions change.
Conclusions
These simulations lead us to concluding that the influence of meteorological conditions is more noticeable in winter and autumn months. This is because when adding meteorological data from other years, the concentration of nitrogen compounds increases. The same is true for carbon monoxide. However, in the summer months, the concentrations hardly change at all.
Given the basis of this first study, we can conclude that not only traffic determines pollution levels, but that variability due to fluctuations in meteorological conditions plays a relevant role in assessing the efficiency of traffic reduction measures. These conclusions are in line with existing air quality literature, which highlights the importance of considering both emission sources (e.g. traffic) and meteorological conditions for air pollution management.
This article is based on the Master's thesis of our colleague Sergio Natal. If you want to know more details, you can access it in this repository of the University of Cantabria.