
Summer officially starts today! So we’ve (swim)suited up, put our flip-flops on, spread sunscreen even in the most out-of-reach parts of our backs and placed our cup properly on our heads. Why you ask? Because we want to talk about summer. About the European summer of the future in particular.
In a recent blog post e presented some data on mainland Spain and the Balearic islands showing a generalised extension of summer over the past few decades. However, we now want to look into the future and from a continental perspective – How will summer be in the Old Continent in the years to come?
Before venturing into that, we should remind readers it is the astronomical summer that starts today, whilst meteorological summer started three weeks ago – did you know that?
Back to our main subject today. In the case of Spain and according to the Meteorology State Agency, summer has extended an average of nine days per decade or five weeks since the 80s. Is it a shared trend in the rest of the European neighboring countries?
Let’s see what it will be like in Rome, for instance
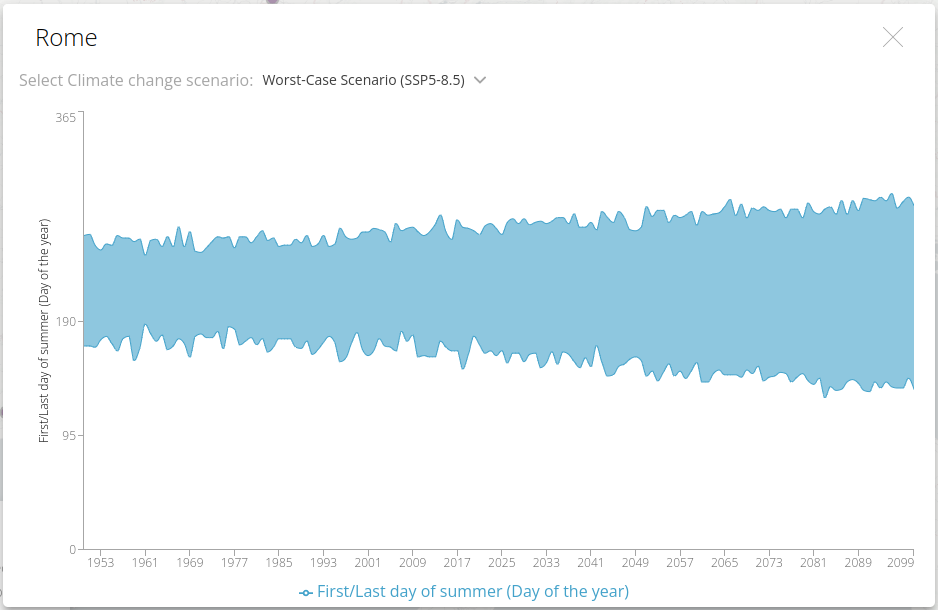
So, the worst-case scenario, in which humans keep releasing greenhouse gases into the atmosphere unrestricted, Rome would go from a 100-110-day long summer to a 150-160-day one by the end of the century.
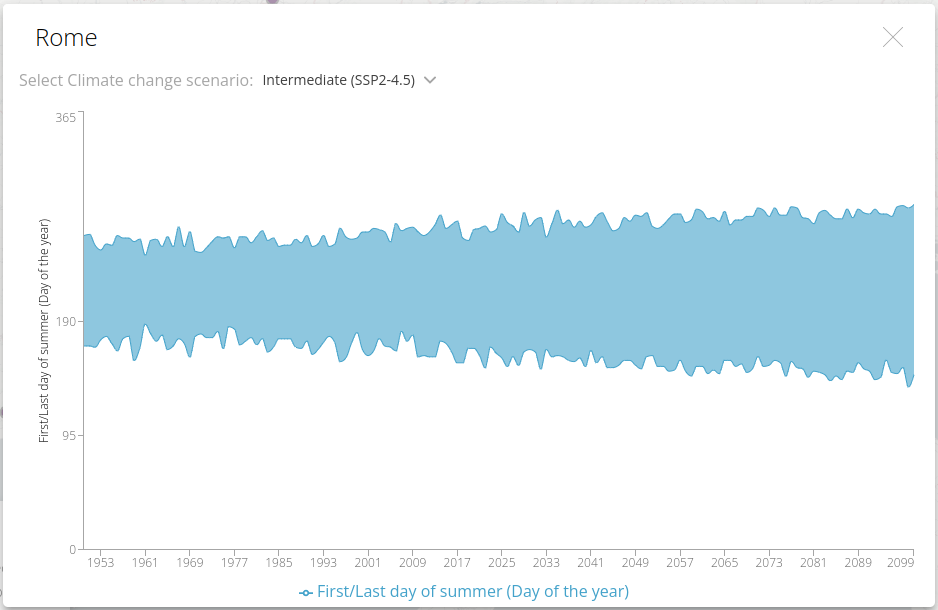
An intermediate scenario, like the one shown below, could translate into Roman summer extending to up to 140 days by the time we enter the 22nd century.
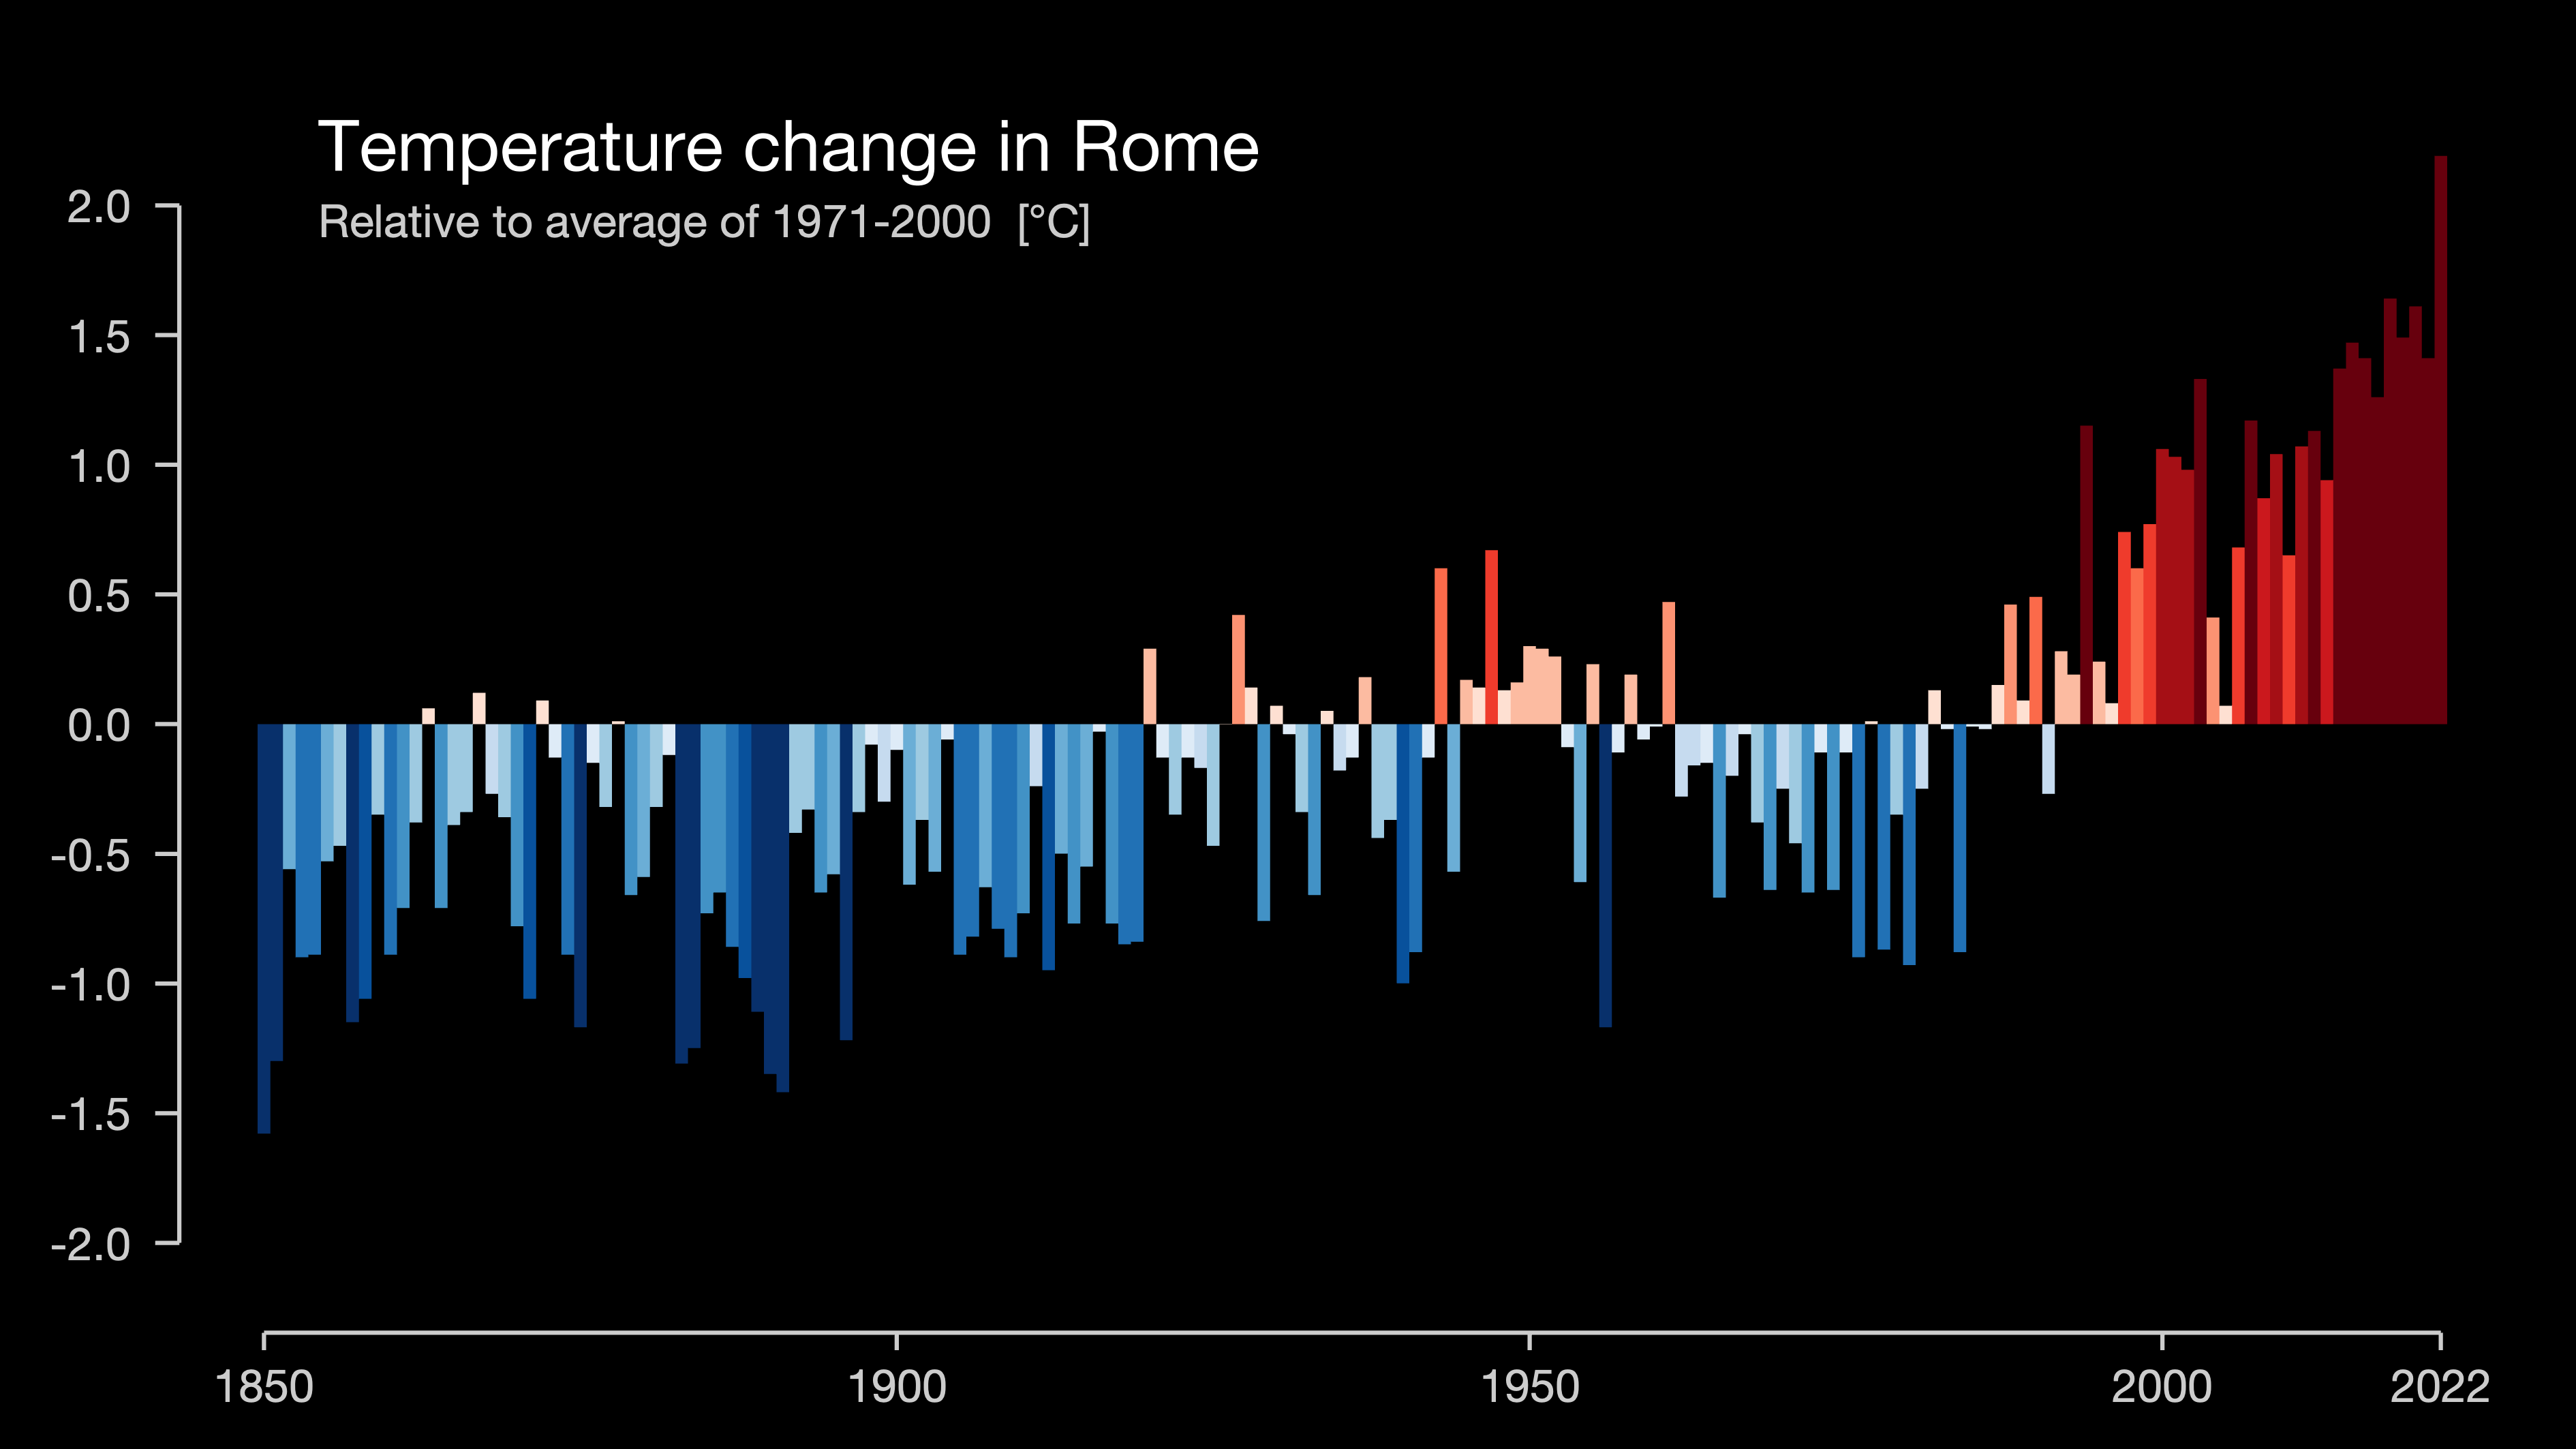
The funnel diagram, this trend towards summer extension that our simulations show [detailed methodology explained at the end of the post] for the Italian capital is a constant that reminds of the progressive increase in temperature found on Ed Hawkins’ warming stripes that you may see below. Although this diagram is not focusing on summer extension, the temperature rise shown allows for the season to extend its duration, according to the definition of summer we’ve used here.
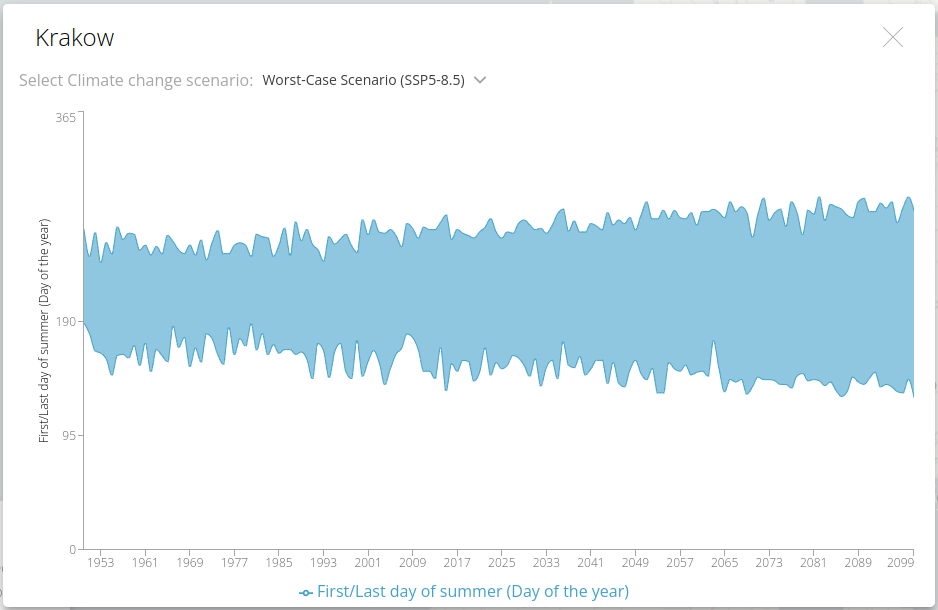
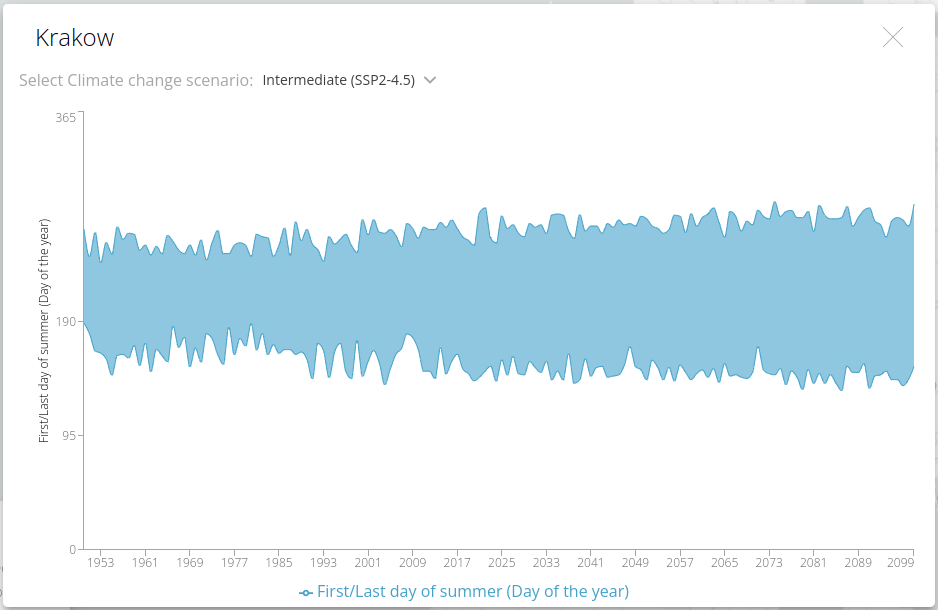
We find similar figures in both scenarios in Krakow, over a thousand kilometers North-East from Rome:
And how about the Northern tip of the United Kingdom? Let’s travel to Aberdeen, over 1600 kilometres North-West from Krakow...
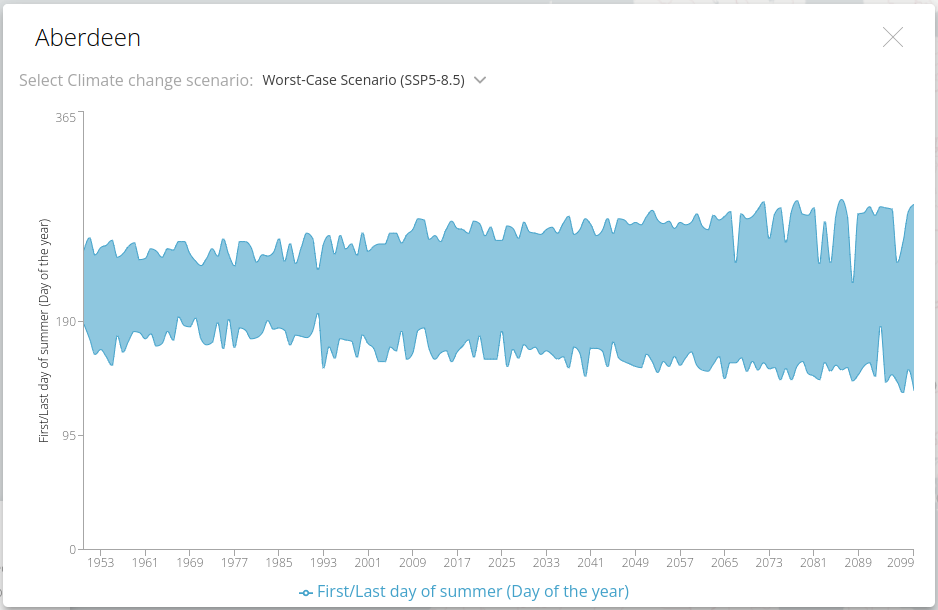
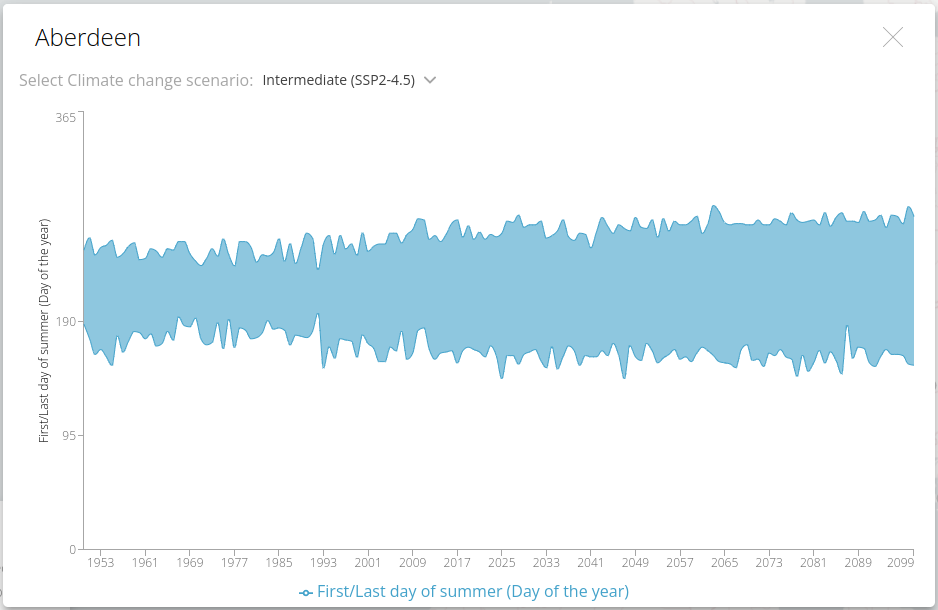
… where we find the impact of global warming and climate change will be felt similarly there too. From around 90-100 days today it will reach a 130-150-day long summer, depending on which scenario (business as usual or intermediate) we look at..
All this is on summer duration, for which we turned to the following AEMET definition again:
first 7 days in a row from 1st May on where the maximum temperature equals or tops the mean maximum temperature registered between 18-24 June in the period 1981-2010. Same goes for the end of summer - last 7 days in a row up to 31st October where the maximum temperature equals or tops the mean maximum temperature registered between 18-24 September in the period 1981-2010
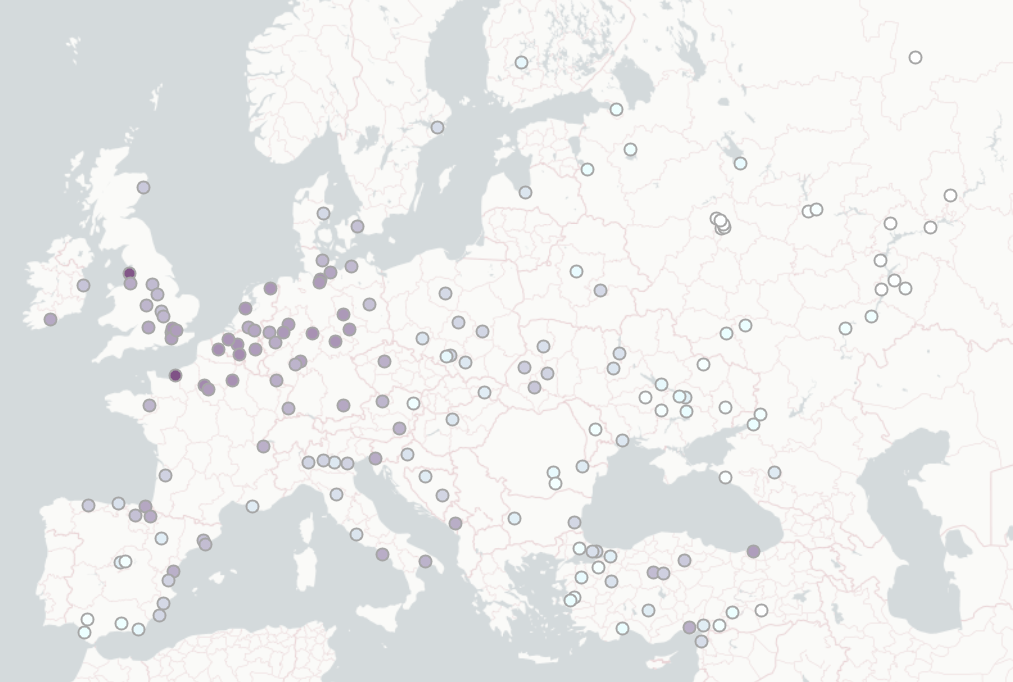
But we could also talk about how summer will start earlier or push their ending forward – what are the trends that caught our eye?
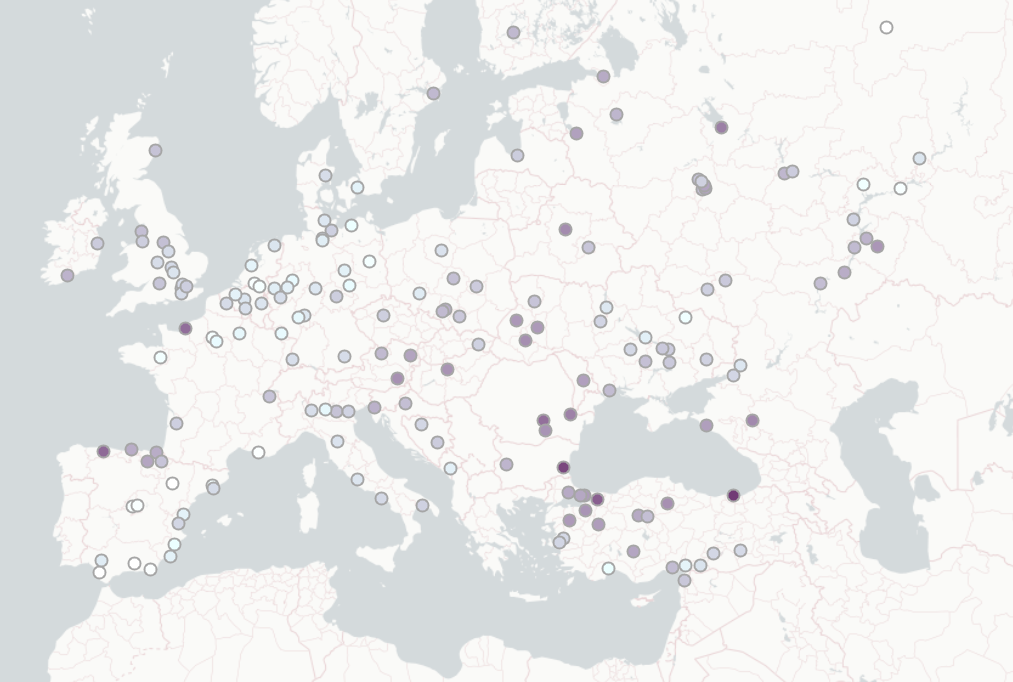
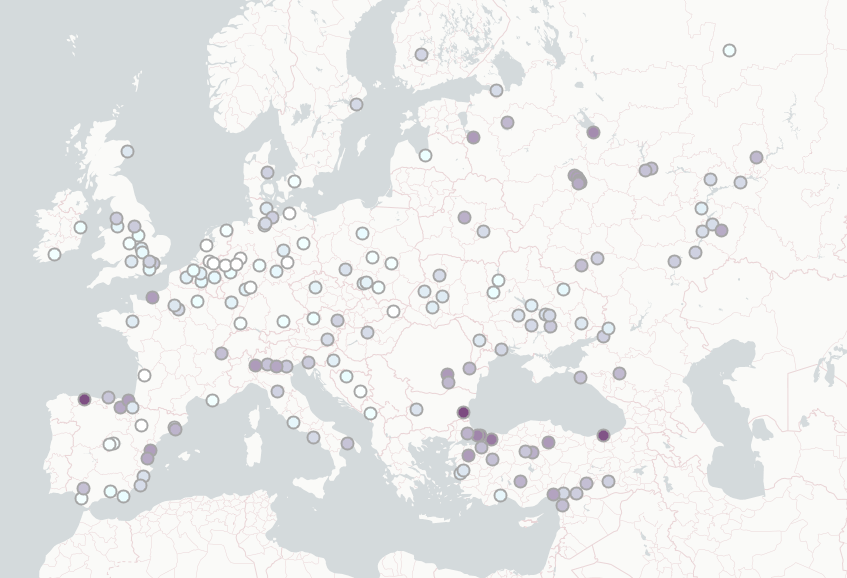
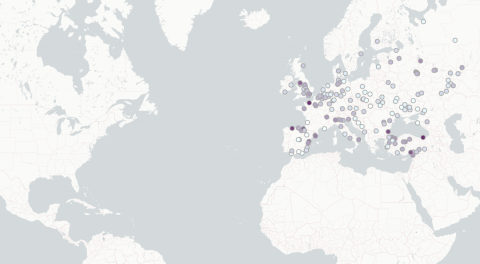
Above we observed summer will start at an earlier date around the Black Sea and Northern Spain, where the dots are darker in both scenarios. Meanwhile, below you can see summer will come to an end at a later date in Western Europe, with darker shades of purple around Northern France, Belgium, the Netherlands, Western Germany and the United Kingdom.

We’ve used CMIP6 climate change models for obtaining these data, and we’ve adjusted them by using ERA5-Land reanalysis through our climate-projections bias-adjustment tool Climadjust. In this case, we chose the ISIMIP3 bias-adjustment technique, since it tends to reproduce both trends and extremes accurately.
If you wish to, you may kill some time checking what will happen to the end of summer, its beginning and its duration until 2099 in 178 European cities and towns, from Cork to Diyarbakir to Severodvinsk. You just need to click here, where most of the diagrams featured on this post are coming from.
And should you be interested in custom climate projection services, don’t hesitate to contact us at predictia@predictia.es.