With this section on our blog we want to go beyond temperature, precipitation and wind, to explore other meteorological and climate indicators that are relevant, specially for specific sectors like agriculture, energy, water management or insurance.
Temperature lies behind many of our daily behaviours. We crank up the heater in winter, while in the summer we might go for an ice cream, or stay home near the air conditioning if it’s too hot outside. Although at an individual level it looks simple, if we take a look at a societal level things get more interesting and impactful. Hotter and colder days drive energy consumption (and can lead to power outages like in Texas back on February1), affect people’s health (especially those with respiratory and cardiovascular conditions2), and impact many other areas like traffic levels or productivity. However, temperature is not everything that’s at play here. For many of the effects we have described above, the key lies in a threshold temperature. We humans are comfortable in a range of temperature that lies somewhere in between 20 °C and 27 °C, depending on clothing, humidity, geography... Outside of that zone is usually when we can see the effects of temperature in our individual behaviour—and therefore in energy consumption trends and other impacts. But how do we measure and quantify this?
There’s a climate index for that: heating and cooling degree days
In this case, the indicator that we use is called heating and cooling degree days. It’s a measure that was designed initially to quantify the demand for energy needed to heat or cool a building. Essentially, they measure how much the daily temperature exceeds a certain threshold.
The recipe to calculate this index is pretty simple:
- Obtain the average outdoor temperature for a day by taking the day's high and low temperatures.
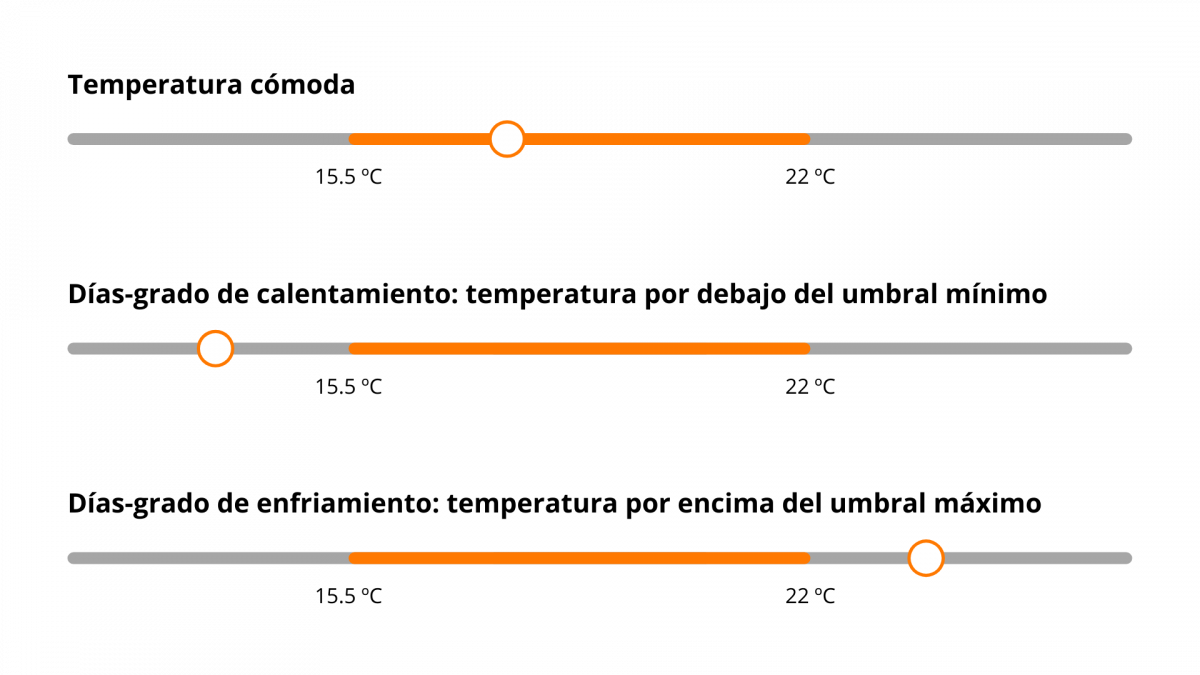
- If it falls within the “sweet spot temperature” zone, there’s no heating or cooling degree days for that day. If it’s above the upper threshold you have defined, subtract the upper threshold to the average temperature, and that’s the number of cooling degree days for that day. If it’s below the lower threshold, subtract the average to the lower threshold.
- Repeat for each day in the period of time you’re interested in and sum up the daily results.
In this way, we have a quantifiable indicator to start modelling and try to find relationships between temperature levels and other effects. While this may look simple, the devil is in the details.
Setting a threshold: not as easy as it looks
Although the recipe we pointed out before is quite simple, reality is always more complex. For example, when we talk about buildings, the baseline temperatures vary greatly from country to country if we look at different institutions. For the European Environmental Agency, the baseline for heating degree days is 15.5 °C3. For the Danish Technological Institute, it’s 17 ºC4. And in Spain, for the Spanish Platform for Climate Adaptation5, the threshold is 18 ºC. If we are talking about heating and cooling buildings, there are more aspects to look at, like the differences between comfort levels between home and office settings, the isolation quality of the building, and even gender biases6 in heating and cooling levels.
That’s why it’s important that climate modellers and sector specialists work hand in hand in each assessment. We can take the data for energy consumption, for example, and cross reference it with weather records, to try and set a specific threshold that works in that environment.
Going beyond daily resolution
In our initial recipe we used the daily average outdoor temperature. However, temperature levels are not distributed equally along the day. In reality, only a fraction of the day surpasses the baseline temperatures defined for the Heating and Cooling Degree Days, so for some specific applications, it is more relevant to look at specific periods of time within the day7. While this can be done, it’s not always an easy path.
Always check the biases
Since the key point in these climate indexes is the temperature threshold, potential biases in temperature records and projections onto the future become crucial. Thus, if you’re using climate models, their outputs should be post-processed using bias correction algorithms8. This is one of the reasons why we developed Climadjust.
Sectors where heating and cooling degree days are useful
There’s a wide variety of sectors that use Heating and Cooling Degree Days:
- Energy: is the initial sector for which these climate indexes were conceived. In this case, Heating and Cooling Degree Days are proxies for the energy demand needed to heat or cool, respectively, a home or a business.
- Construction and urban planning: as urban planners and policy makers are taking climate adaptation into their decisions, heating and cooling degree days, when projected into future climate change scenarios this climate indexes provide insights into energy consumption and isolation needs in the future.
- Agriculture: in this case, crops grow well within certain range temperature days. Planning in agriculture makes use of a related index to Heating degree days. It’s called growing degree days and we will get into it on another blog post.
Do you work with this or other climate indexes? Drop us a line, we'll be glad to help you with them!
[1] Bloomberg - How Extreme Cold Turned Into a U.S. Energy Crisis
[2] Word Health Organization - Heat and Health
[3] EEA - Heating and cooling degree days
[4] Danish Technological Institute - Graddage - Hvad er graddage?
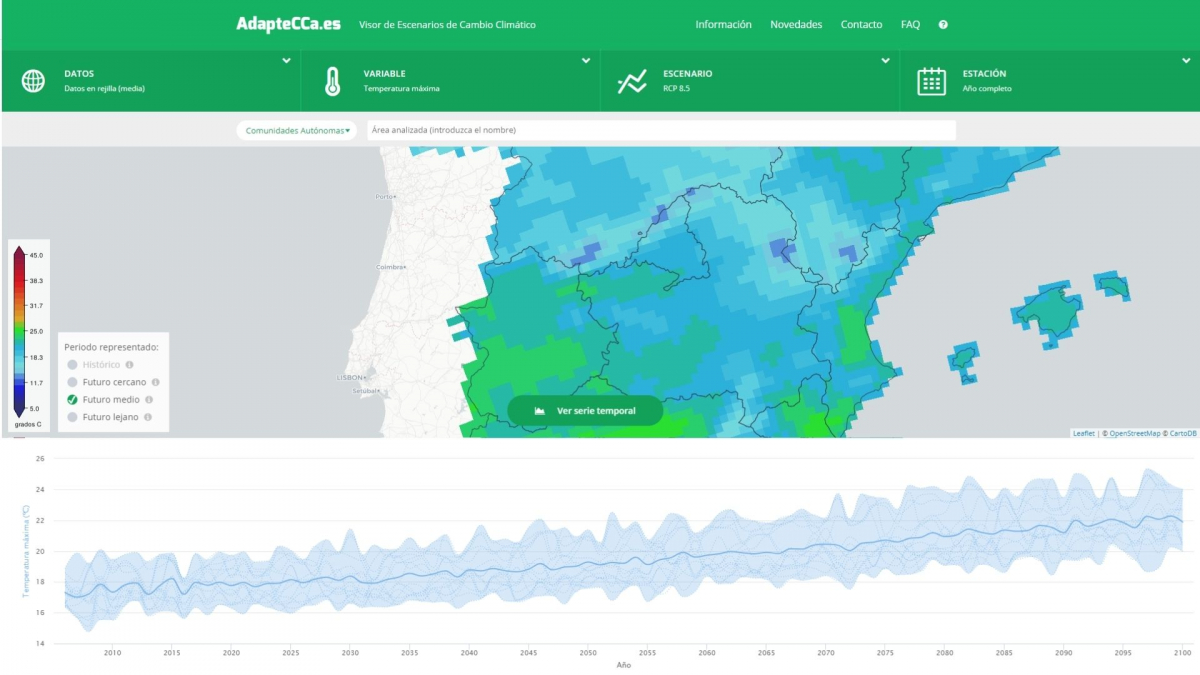
[5] AdapteCCa - Climate scenarios viewer
[7] European degree‐day climatologies and trends for the period 1951–2011