
Air pollution was behind at least 4.2 million premature deaths worldwide, according to World Health Organization (WHO) estimates. This UN agency warns air pollution is “one of the greatest environmental risks to health” and claims reducing air pollution would slash the risks of stroke, lung cancer and asthma, among other pathologies.
In this context, getting to know, controlling and predicting the quality of the air we breathe everyday becomes vital information for human health worldwide – WHO alerts 99% of the world’s population lived in areas where its guidelines for air quality were not met in 2019.
To address this, the Copernicus Atmosphere Monitoring System (CAMS) has been providing consistent information over the past few years, with a strict quality control of the atmosphere components affecting air quality. For example, CAMS offers real-time forecasts of a set of meteorological agents and of the composition of the atmosphere.
However, these global-scale forecasts show a systematic bias or deviation from observations, as can be seen in the following diagram:
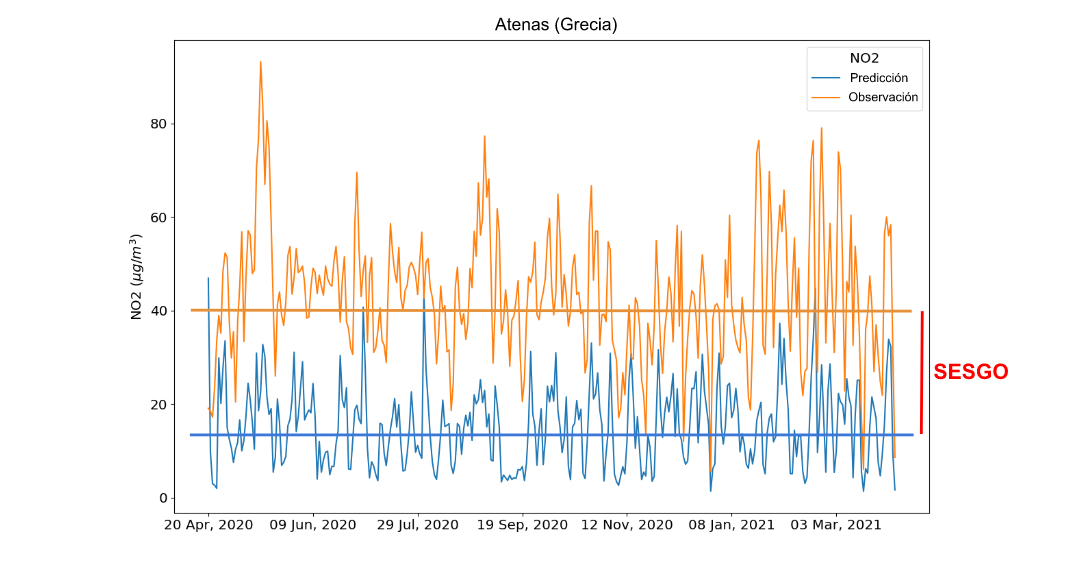
With the ultimate goal of correcting that important bias in mind, our colleagues Antonio Pérez and Mario Santa Cruz took up one of the ECMWF 2021 Summer of Code (ESoWC) challenges. This would result in a deep learning model to correct air-quality forecast bias in the context of CAMS using several open data sources, among which was available observations data from the OpenAQ platform. Let’s get to it.
Architecture adapted to the nature of the data
In order to achieve this, they developed a specific architecture that would allow to exploit all available information for bias assessment (Fig 2, below) in the public repository AQ-BiasCorrection. Due to the heterogeneity of the nature of the mentioned data, Mario and Antonio created three independent modules. The first two of them have a common structure and receive the CAMS variables with a temporal dimension as input. The only difference between these two modules is one of them uses the day-before variables (including observations and forecasts) and the other one uses the day-ahead forecasts. The third module extracts the most relevant station attributes.
The features extracted by these three modules are used by a multi-layer perceptron network to predict time bias over the following hours.
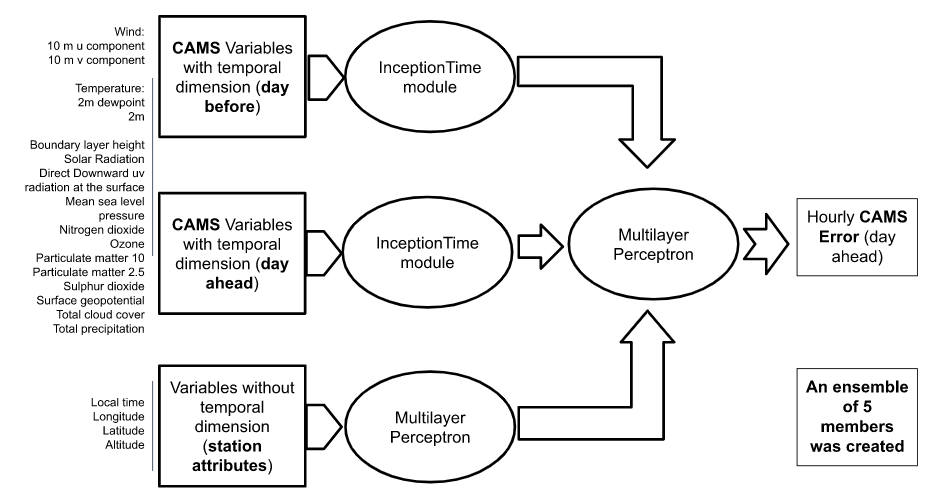
In addition, aiming at reducing variability in model performance a group of five trained models with random initialisations of their weights was considered.
General improvement of CAMS forecasts
CAMS forecasts of air-quality variables were really biased regardless of location and variable (the average bias was -22.76, 44.30, 12.70 for NO2 , O3, and PM2.5, respectively). Furthermore, model performance - measured according to Pearson correlation – didn’t reach 0.5 for none of the variables, with unusually low levels for NO2 and O3.
- ρNO2=0.10
- ρO3=0.14
The bias correlation system developed achieved a global reduction of CAMS forecast bias. For instance, the number of stations where biases were reduced both in the training set and in test were 52 out of 61 (85%) for NO2, 62/67 (92%) for O3 and 80/102 (78%) for PM2.5.
Overall, the average bias in the studied stations was reduced by 1.1%, 9.7% and 13.9% for NO2, O3 and PM2.5, respectively. Besides, there was increased model performance with a 100%-400% range improvement for each variable.
In the image below (Fig. 3) the example of Glasgow, UK, can be seen. It shows different O3 forecasts vs observations.
Want to know more? You may watch the final presentation of the ESoWC 2021 as well as the one our colleagues did for EGU 2022.
And needless to say - should you need high-precision air-quality forecasts in your area, don’t hesitate to reach out to our team via predictia@predictia.es.