With this section on our blog we want to go beyond temperature, precipitation and wind, to explore other meteorological and climate indicators that are relevant, specially for specific sectors like agriculture, energy, water management or insurance.
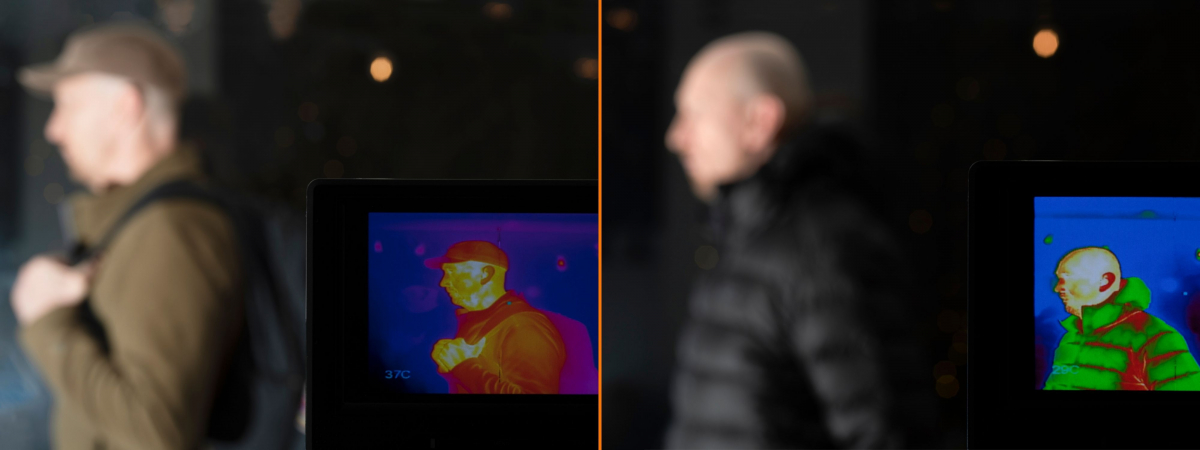
25ºC do not feel the same everywhere. While in a coastal city they may start to feel a little too warm, in some inland cities it can even feel a bit chill. Thermometers experience reality in a more limited way than we humans do. We feel not only temperature, but humidity, wind, solar radiation… and the integration of all these factors creates the sensation of being too hot, too cold… or “just perfect”. So, how do we measure this?
There’s a climate index for that: UTCI
You may have heard of “apparent temperature”. The term appeared first in 1984, on a paper titled “A universal scale of apparent temperature”, by Robert G. Steadman. And a lot of private companies have their own version of it: Accuweather has RealFeel, The Weather Company has FeelLike. The challenge with these indicators is that they are bound to trade secrets. However, there’s one indicator that is open, and takes into account numerous factors: Universal Thermal Climate Index, or UTCI. The UTCI is part of a set of indices that the European Environmental Agency classifies as “Thermal Comfort Indices”. What makes UTCI so complete is that it incorporates multiple weather conditions (air temperature, wind, humidity and radiation), as well as modelling how our bodies respond to heat.
Modelling our bodies: the devil’s in the details
Developing UTCI is not easy. And, as everything in science, it is subject to constant revisions and adjustments. Back in 2004, the European Commission launched COST Action 730, to define a well-adjusted UTCI. Behind this unassuming name was a consortia of 17 experts, from a myriad of meteorological institutions. Later on, more experts from all around the word took part in this research action. Their objective was to define an index that was:
- valid in all climates, seasons and scales
- useful for key applications in human biometeorology (e.g. daily forecasts, warnings, regional and global bioclimatic mapping, epidemiological studies, and climate impact research)
- thermophysiologically significant in the whole range of heat exchange
- independent of a person's characteristics (age, gender, specific activities and clothing etc.)
One of the more challenging points was how to model human response to heat. Fiala et al.1 managed to develop computer simulation of our thermoregulatory systems, to compute how we experience the weather conditions. It’s a complete model, including inherent aspects of our bodies (metabolism, heat exchange through evaporation, heat convection), and our reactions to environmental conditions (like shivering, sweating or vasodilation).
Impacts: beyond temperature
Deaths related to heat waves2, heat strokes3, low concentration and reduced memory due to cold sensation4... all of these impacts are better explained and predicted by UTCI rather than temperature. And it’s natural: our bodies respond not only to temperature, but to wind, humidity and radiation.
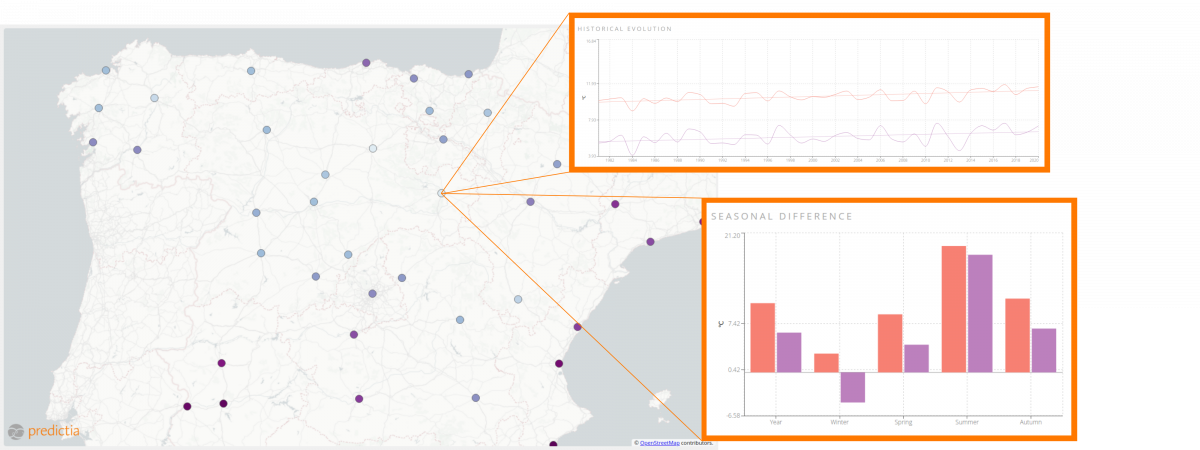
In one of our Showcases, we explore the difference between UTCI and temperature for every Spanish province capital city. You’ll be able to see seasonal differences, specific days in which the difference between temperature and UTCI broke records, and much more. With it, we wanted to illustrate the gaps that exist between UTCI and temperature. And in some cases, these gaps are specially relevant. Here are some examples:
- A Coruña: a coastal city in the north of Spain, where, in average, UTCI is 5 ºC colder than the temperature. This is specially relevant in winter, where the difference is of 8ºC.
- Teruel: an inner city famous for their Serrano ham… and their cold, harsh winters. And the data reflect this impression. On average, their winters have temperatures of 3 ºC… and a freezing UTCI that goes below 0ºC: - 3ºC.
- Almería: a coastal city in the Spanish sunny south. For specific days, the combination of temperature, humidity and direct solar radiation cause the weather to feel much hotter than what the thermometer says. While the temperature reaches 32ºC, the UTCI spikes up to 40 ºC.
Due to examples like these ones, we think that UTCI is much more informative than just temperature. What do you think?
Visit our showcase and keep exploring!
Additional information
1] Fiala, Dusan & Univ, Leicester. (1998). Dynamic Simulation of Human Heat Transfer and Thermal Comfort. Link
[2] Di Napoli, C., Pappenberger, F. & Cloke, H.L. Assessing heat-related health risk in Europe via the Universal Thermal Climate Index (UTCI). Int J Biometeorol 62, 1155–1165 (2018). Link
[3] Frank C. Curriero, Karlyn S. Heiner, Jonathan M. Samet, Scott L. Zeger, Lisa Strug, Jonathan A. Patz, Temperature and Mortality in 11 Cities of the Eastern United States, American Journal of Epidemiology, Volume 155, Issue 1, 1 January 2002, Pages 80–87, https://doi.org/10.1093/aje/155.1.80
[4] Holmér, I., Hassi, J., Ikäheimo, T.M. and Jaakkola, J.J.K. (2012). Cold Stress: Effects on Performance and Health. In Patty's Toxicology (eds E. Bingham, B. Cohrssen and C.H. Powell). https://doi.org/10.1002/0471435139.tox097.pub2