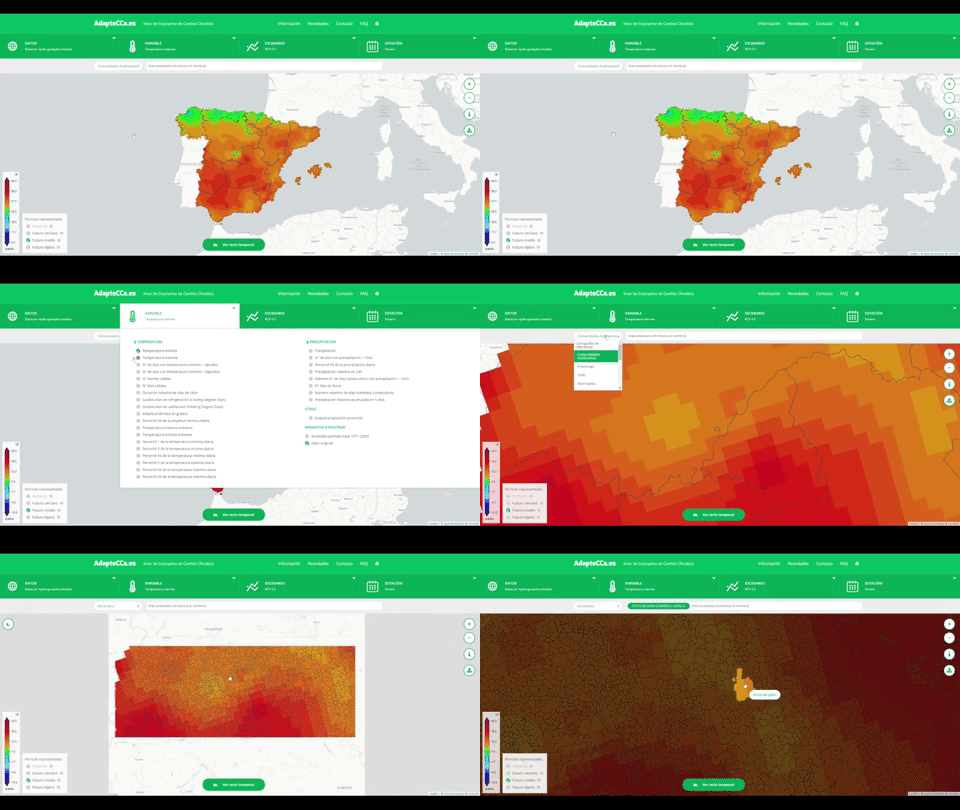
We recently updated the climate change scenario viewer that we developed for AdapteCCa, the Platform on Adaptation to Climate Change in Spain. In this new version, we have made major changes: incorporating new download options, new climate indices, custom visualisation options and more. As always, these new developments have been guided by the needs of the users of the platform, which currently exceeds 1000 monthly users.

Preview of the climate change scenario viewer
New download options
From now on, users will be able to consult and download information on climate projections for each of the months of the year, through the "SEASON" selection menu. With this we wanted to expand the consultation and download options, which previously allowed the same process to be carried out for the different seasons and for the whole year.
5 new climate indices
We have incorporated the following indices, related to the temperature distribution:
- 99th percentile of the daily maximum temperature
- 1 percentile of the daily minimum temperature
- 95th percentile of the daily minimum temperature
- 5th percentile of the daily maximum temperature
- 99th percentile of the daily thermal amplitude
This increases the number of indices and variables available for the gridded dataset (EUROCORDEX) to 31.
Dynamic map legends
With more than 1000 monthly users, the data visualisation needs are very varied. For this reason, we have incorporated dynamic map legends, with which the user can adjust the range of values represented. This facilitates the interpretation of the geographic information provided in the viewer, allowing it to be adjusted to the needs of each user.
New FAQs
Following indications from different users of the platform, we have added new answers to the FAQ section of the Viewer.
